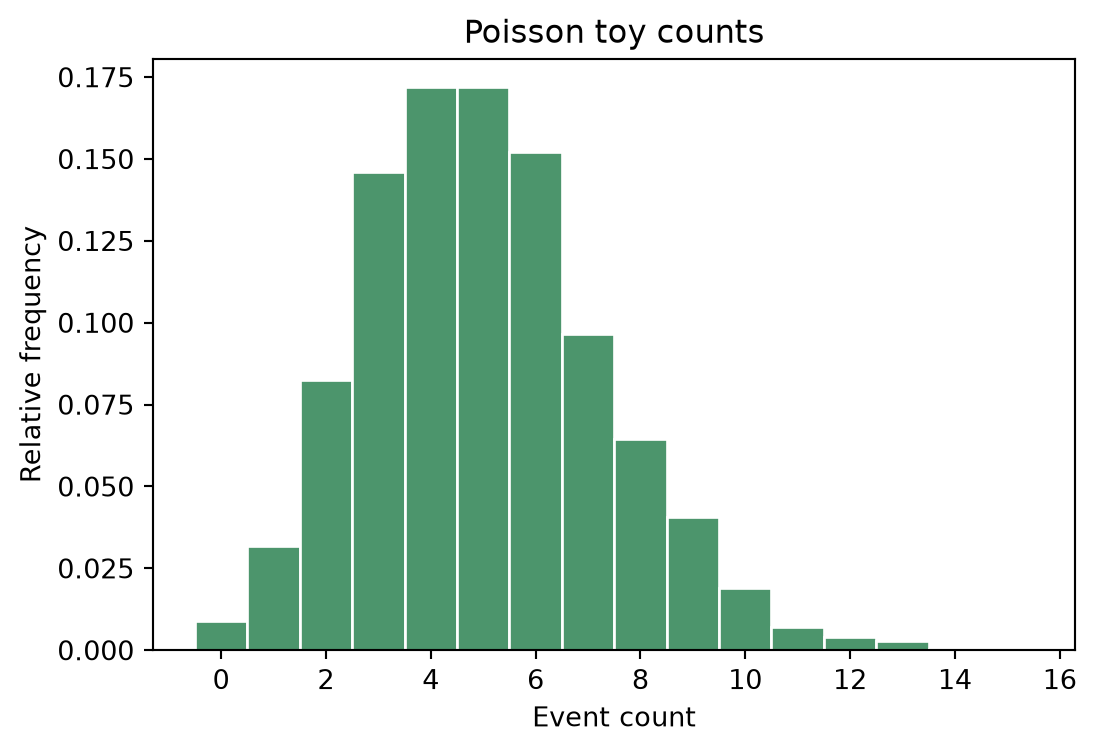
A minimal toy study for Poisson counts.
Toy experiments
import numpy as np
import pandas as pd
import matplotlib.pyplot as plt

rng = np.random.default_rng(42)
lam = 5.0
samples = rng.poisson(lam=lam, size=4000)

pd.DataFrame({
    "quantity": ["theoretical mean", "empirical mean", "empirical variance"],
    "value": [lam, samples.mean(), samples.var()],
})
| 0 |
theoretical mean |
5.000000 |
| 1 |
empirical mean |
5.011000 |
| 2 |
empirical variance |
5.139879 |
Histogram
fig, ax = plt.subplots(figsize=(6.2, 4.0))
ax.hist(samples, bins=np.arange(samples.min(), samples.max() + 2) - 0.5,
        density=True, color="#4c956c", edgecolor="white")
ax.set_xlabel("Event count")
ax.set_ylabel("Relative frequency")
ax.set_title("Poisson toy counts")
plt.show()