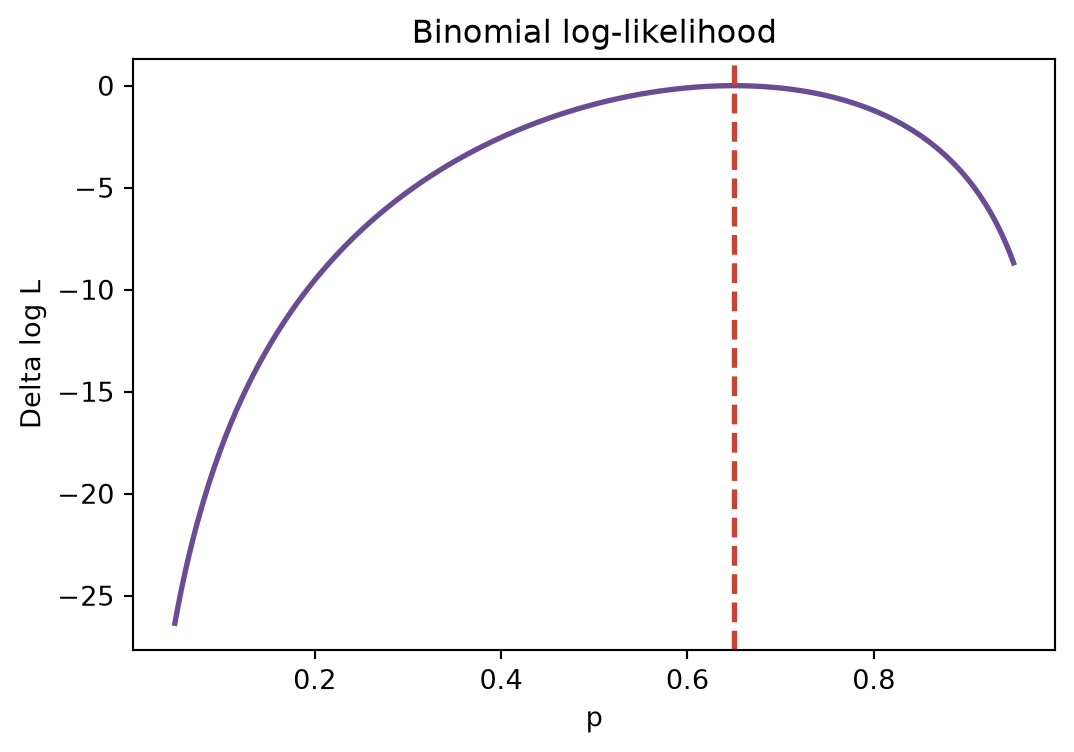
A placeholder for the likelihood chapter: a one-parameter binomial example.
Parameter scan
import numpy as np
import pandas as pd
import matplotlib.pyplot as plt

n = 20
k = 13
p = np.linspace(0.05, 0.95, 300)
logl = k * np.log(p) + (n - k) * np.log(1 - p)
p_hat = k / n

pd.DataFrame({
    "quantity": ["n", "k", "MLE"],
    "value": [n, k, p_hat],
})
| 0 |
n |
20.00 |
| 1 |
k |
13.00 |
| 2 |
MLE |
0.65 |
Profile log-likelihood
fig, ax = plt.subplots(figsize=(6.2, 4.0))
ax.plot(p, logl - logl.max(), color="#6a4c93", linewidth=2)
ax.axvline(p_hat, color="#c44536", linestyle="--", linewidth=2)
ax.set_xlabel("p")
ax.set_ylabel("Delta log L")
ax.set_title("Binomial log-likelihood")
plt.show()