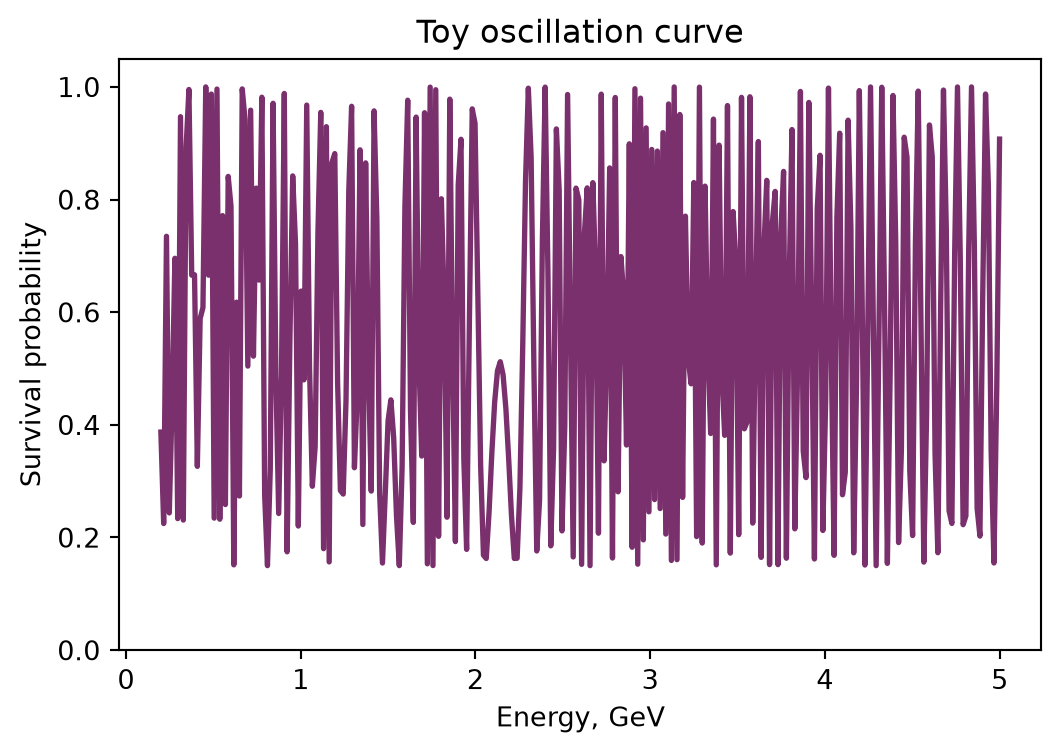
A toy oscillation-style example as a placeholder for the final chapter.
Oscillation-like curve
import numpy as np
import matplotlib.pyplot as plt

energy = np.linspace(0.2, 5.0, 300)
amplitude = 0.85
dm2 = 2.4
baseline = 295.0
phase = 1.267 * dm2 * baseline / energy
probability = 1.0 - amplitude * np.sin(phase) ** 2

fig, ax = plt.subplots(figsize=(6.2, 4.0))
ax.plot(energy, probability, color="#7a306c", linewidth=2)
ax.set_xlabel("Energy, GeV")
ax.set_ylabel("Survival probability")
ax.set_title("Toy oscillation curve")
ax.set_ylim(0.0, 1.05)
plt.show()