Neutrino Telescopes
Principles, Results, and Prospects
A new window on the Universe
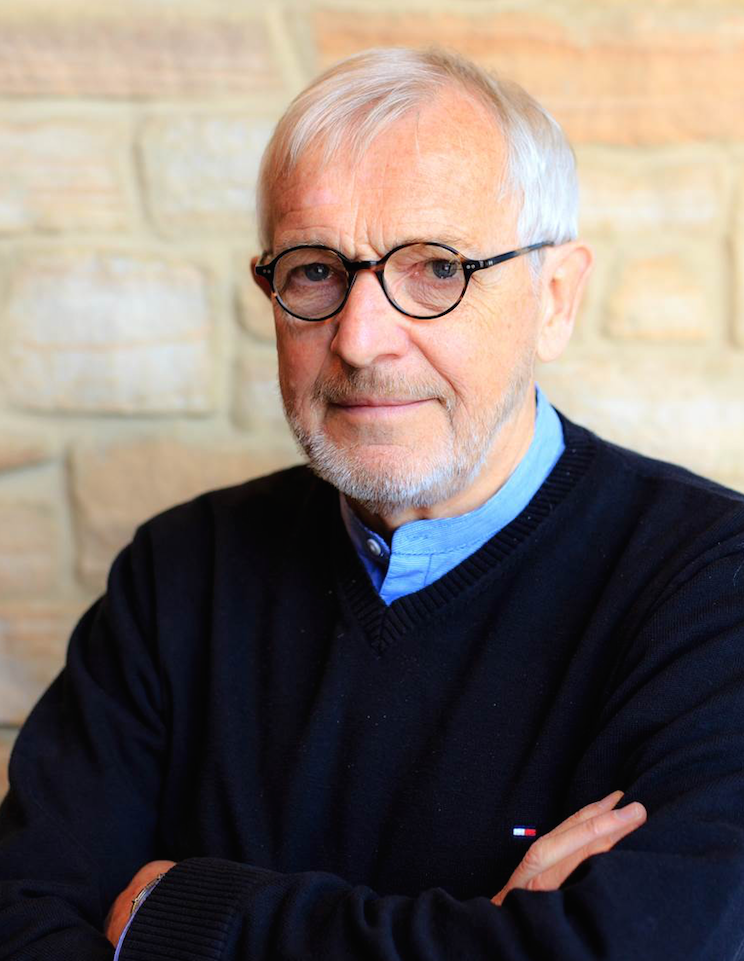
Francis Halzen.
2026 Nobel Prize in Physics
IceCube and the discovery of high-energy astrophysical neutrinos.
Dmitry Naumov to Francis Halzen:
“Let me warmly congratulate you and the entire IceCube Collaboration on this thoroughly deserved Nobel Prize in Physics! … I am Dmitry Naumov — a Baikalist, from JINR (Dubna). We have met several times over the years, most recently at the JUNO cafeteria, where we had lunch together and I even ‘predicted’ your Nobel Prize.”
Francis Halzen to Dmitry Naumov:
“Dmitry, I know you since the Naumov flux and remember the lunch in the JUNO cafeteria very well. Thanks for your very kind message.”
\(1\,\mathrm{PeV} = 10^{15}\,\mathrm{eV}\)
in a single neutrino
a billion times a neutrino from the Sun
over a hundred times a proton in the LHC
Not nuclear fusion. Then what? And where?
Sensor positions: IceCube geometry · light pattern modelled · Bert and Ernie: IceCube 2013 · Big Bird: IceCube 2014, position illustrative
A telescope inside a natural medium
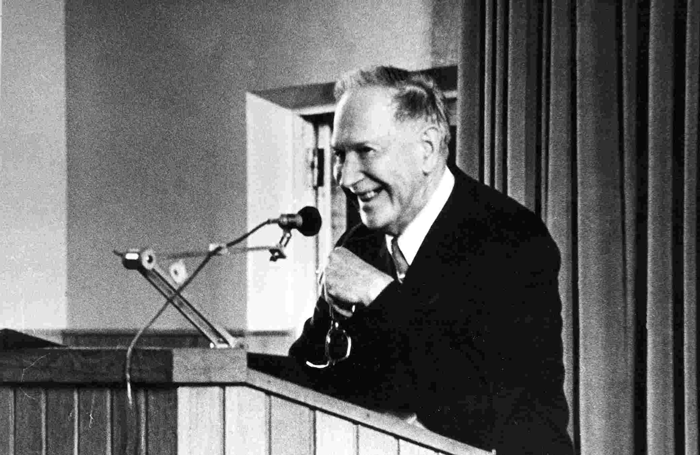
Moisei Markov.
A large target already exists in nature.
- Place light sensors deep in a lake or sea.
- Use Cherenkov light to reconstruct charged particles produced by neutrinos.
M. A. Markov, Rochester conference, 1960, p. 578.
Earlier portrait, date unspecified. INR RAS archive.
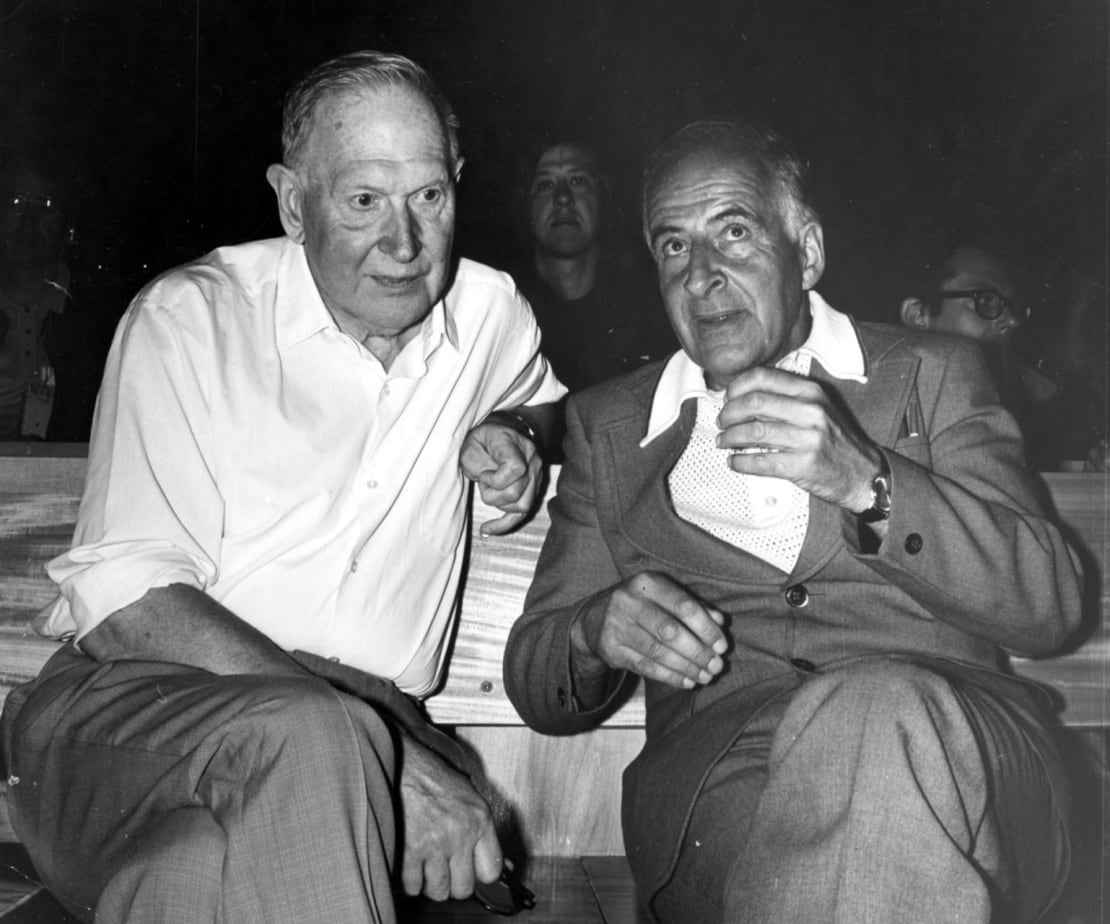
Markov (left) and Bruno Pontecorvo (right), later photograph, undated. IceCube historical archive.
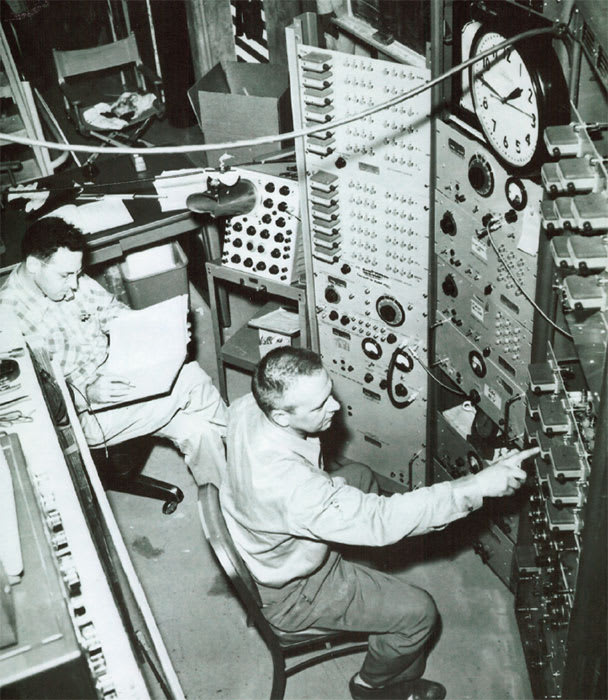
Frederick Reines (left) and Clyde Cowan, 1956. Los Alamos National Laboratory.
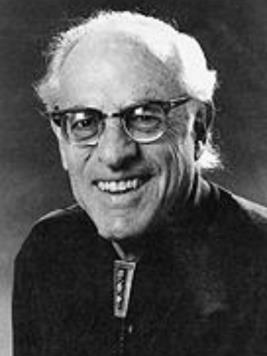
Later portrait, undated. Reproduced in C. Spiering’s historical review.
Neutrino detection first; cosmic-neutrino astronomy next.
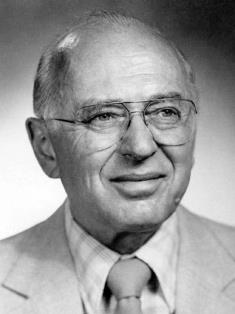
Kenneth Greisen. Undated portrait via C. Spiering.
Greisen, Reines and Markov discussed cosmic-neutrino detection in 1960.
Markov’s underwater proposal supplied a practical route to a very large target.
The physics was compelling. Could the instrument survive and work?
DUMAND: the first deep-ocean attempt
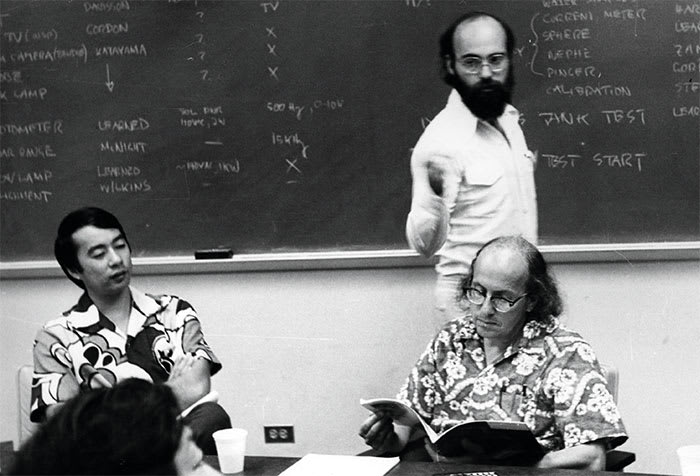
DUMAND workshop, 1976. John Learned at the board; Jed Hirota (left), Dick Davisson (right). Photo: Anatoly Petrukhin, via IceCube.
Deep Underwater Muon And Neutrino Detector
- Reines, Learned and colleagues pursued an ocean array near Hawaii.
- A detector several kilometres below the surface needed entirely new engineering.
1987: a short prototype string, lowered from a ship, recorded muons in the deep ocean.
Summer 1979: the DUMAND workshop meets in Khabarovsk and at Lake Baikal.
- Chudakov, Berezinsky, Bezrukov, Dolgoshein, Petrukhin and Zheleznykh plan the deep-ocean telescope together with the American team.
- December 1979: Soviet troops enter Afghanistan.
- 1980: the American side ends the cooperation.
“…if perchance they included Russians it would be found that no funding was available.”
Arthur Roberts, DUMAND
1980: Chudakov proposes Lake Baikal for a “Russian DUMAND”.
C. Spiering, Eur. Phys. J. H 37, 515 (2012), arXiv:1207.4952, section 4.1; A. Roberts, Rev. Mod. Phys. 64, 259 (1992).
4800 m below the Pacific. Nearly 500 atmospheres.
- December 1993: the first string is connected on the sea floor. It sees muons.
- Over a hundred penetrators lead cables into the pressure housings. One is flawed.
- Seawater seeps in. About ten hours later: a short circuit.
- A fuse fails to clear it. The shore loses contact.
- January 1994: an acoustic signal releases the string from the sea floor.
- 1995: support ends. The array is never built.
In the deep ocean, one connector can decide the fate of an experiment.
DUMAND Collaboration, astro-ph/9412019; C. Spiering, Eur. Phys. J. H 37, 515 (2012), arXiv:1207.4952.
Lake Baikal: the ice becomes a platform
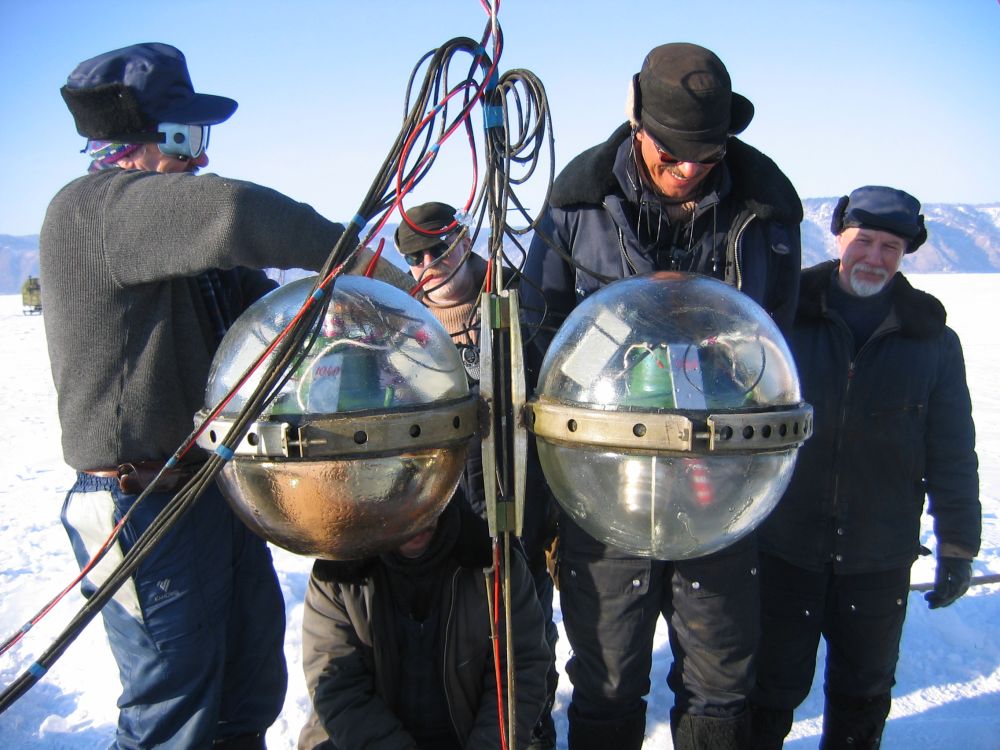
Winter expedition, 2005. DLNP JINR archive.
Alexander Chudakov proposed the site.
- Deep, clear water close to shore.
- A frozen surface for deploying and maintaining the detector.
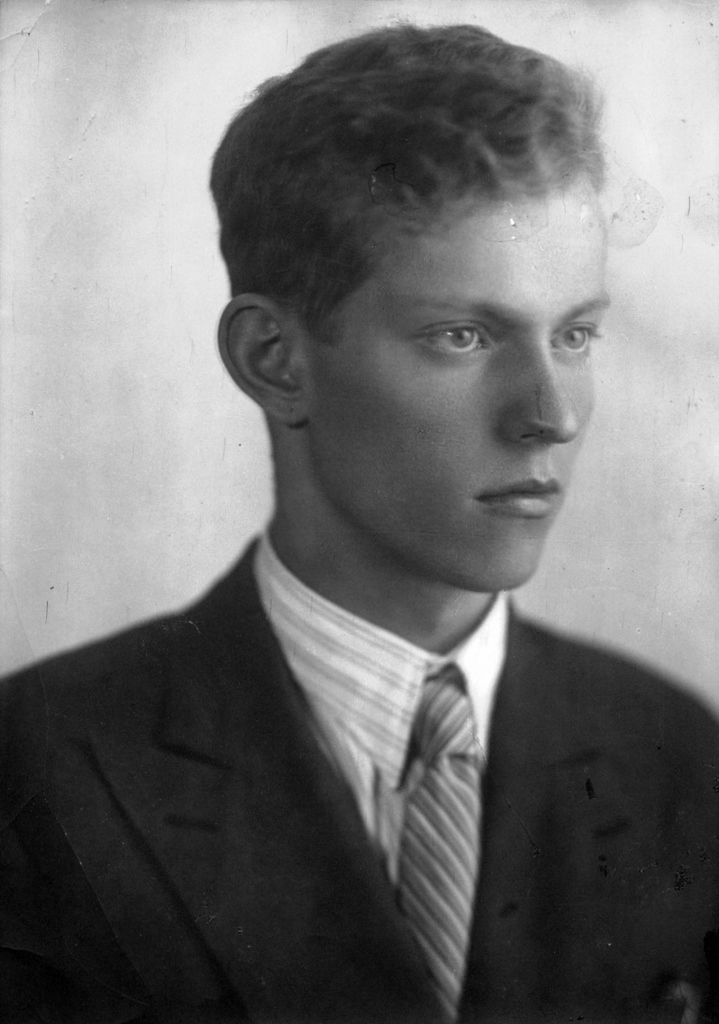
Alexander Chudakov, 1946.
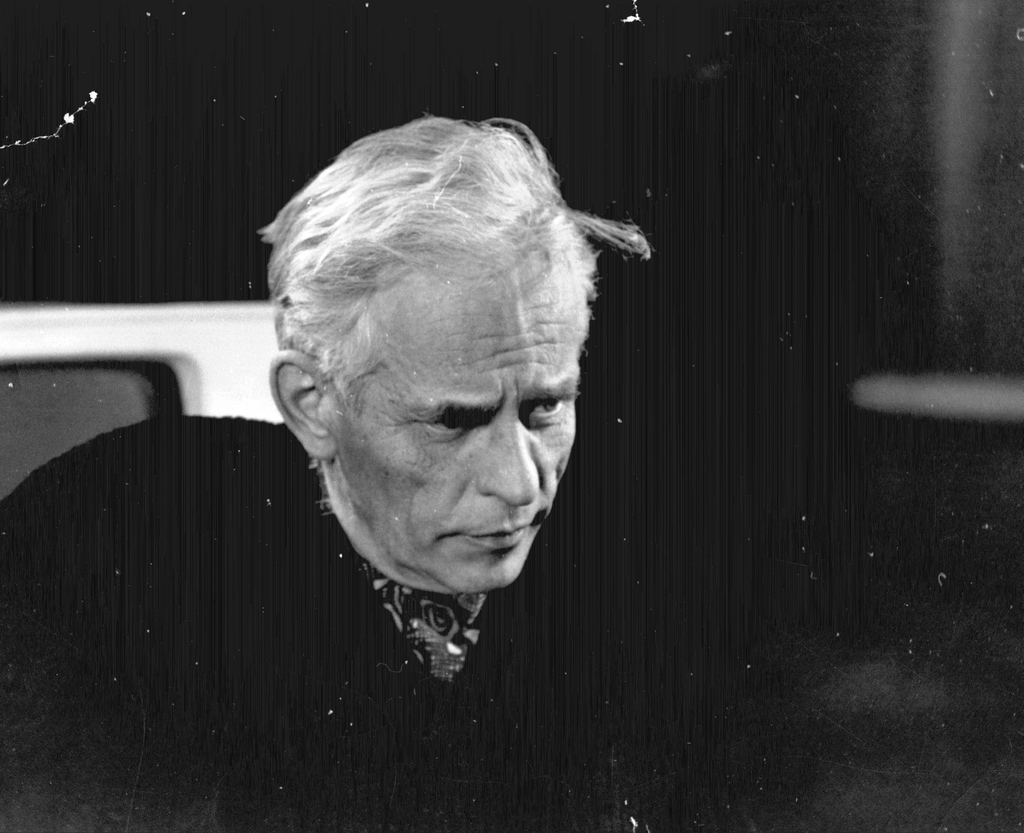
Alexander Chudakov, 1985.
Both dates follow the INR Laboratory of High Energy Leptons photo archive.
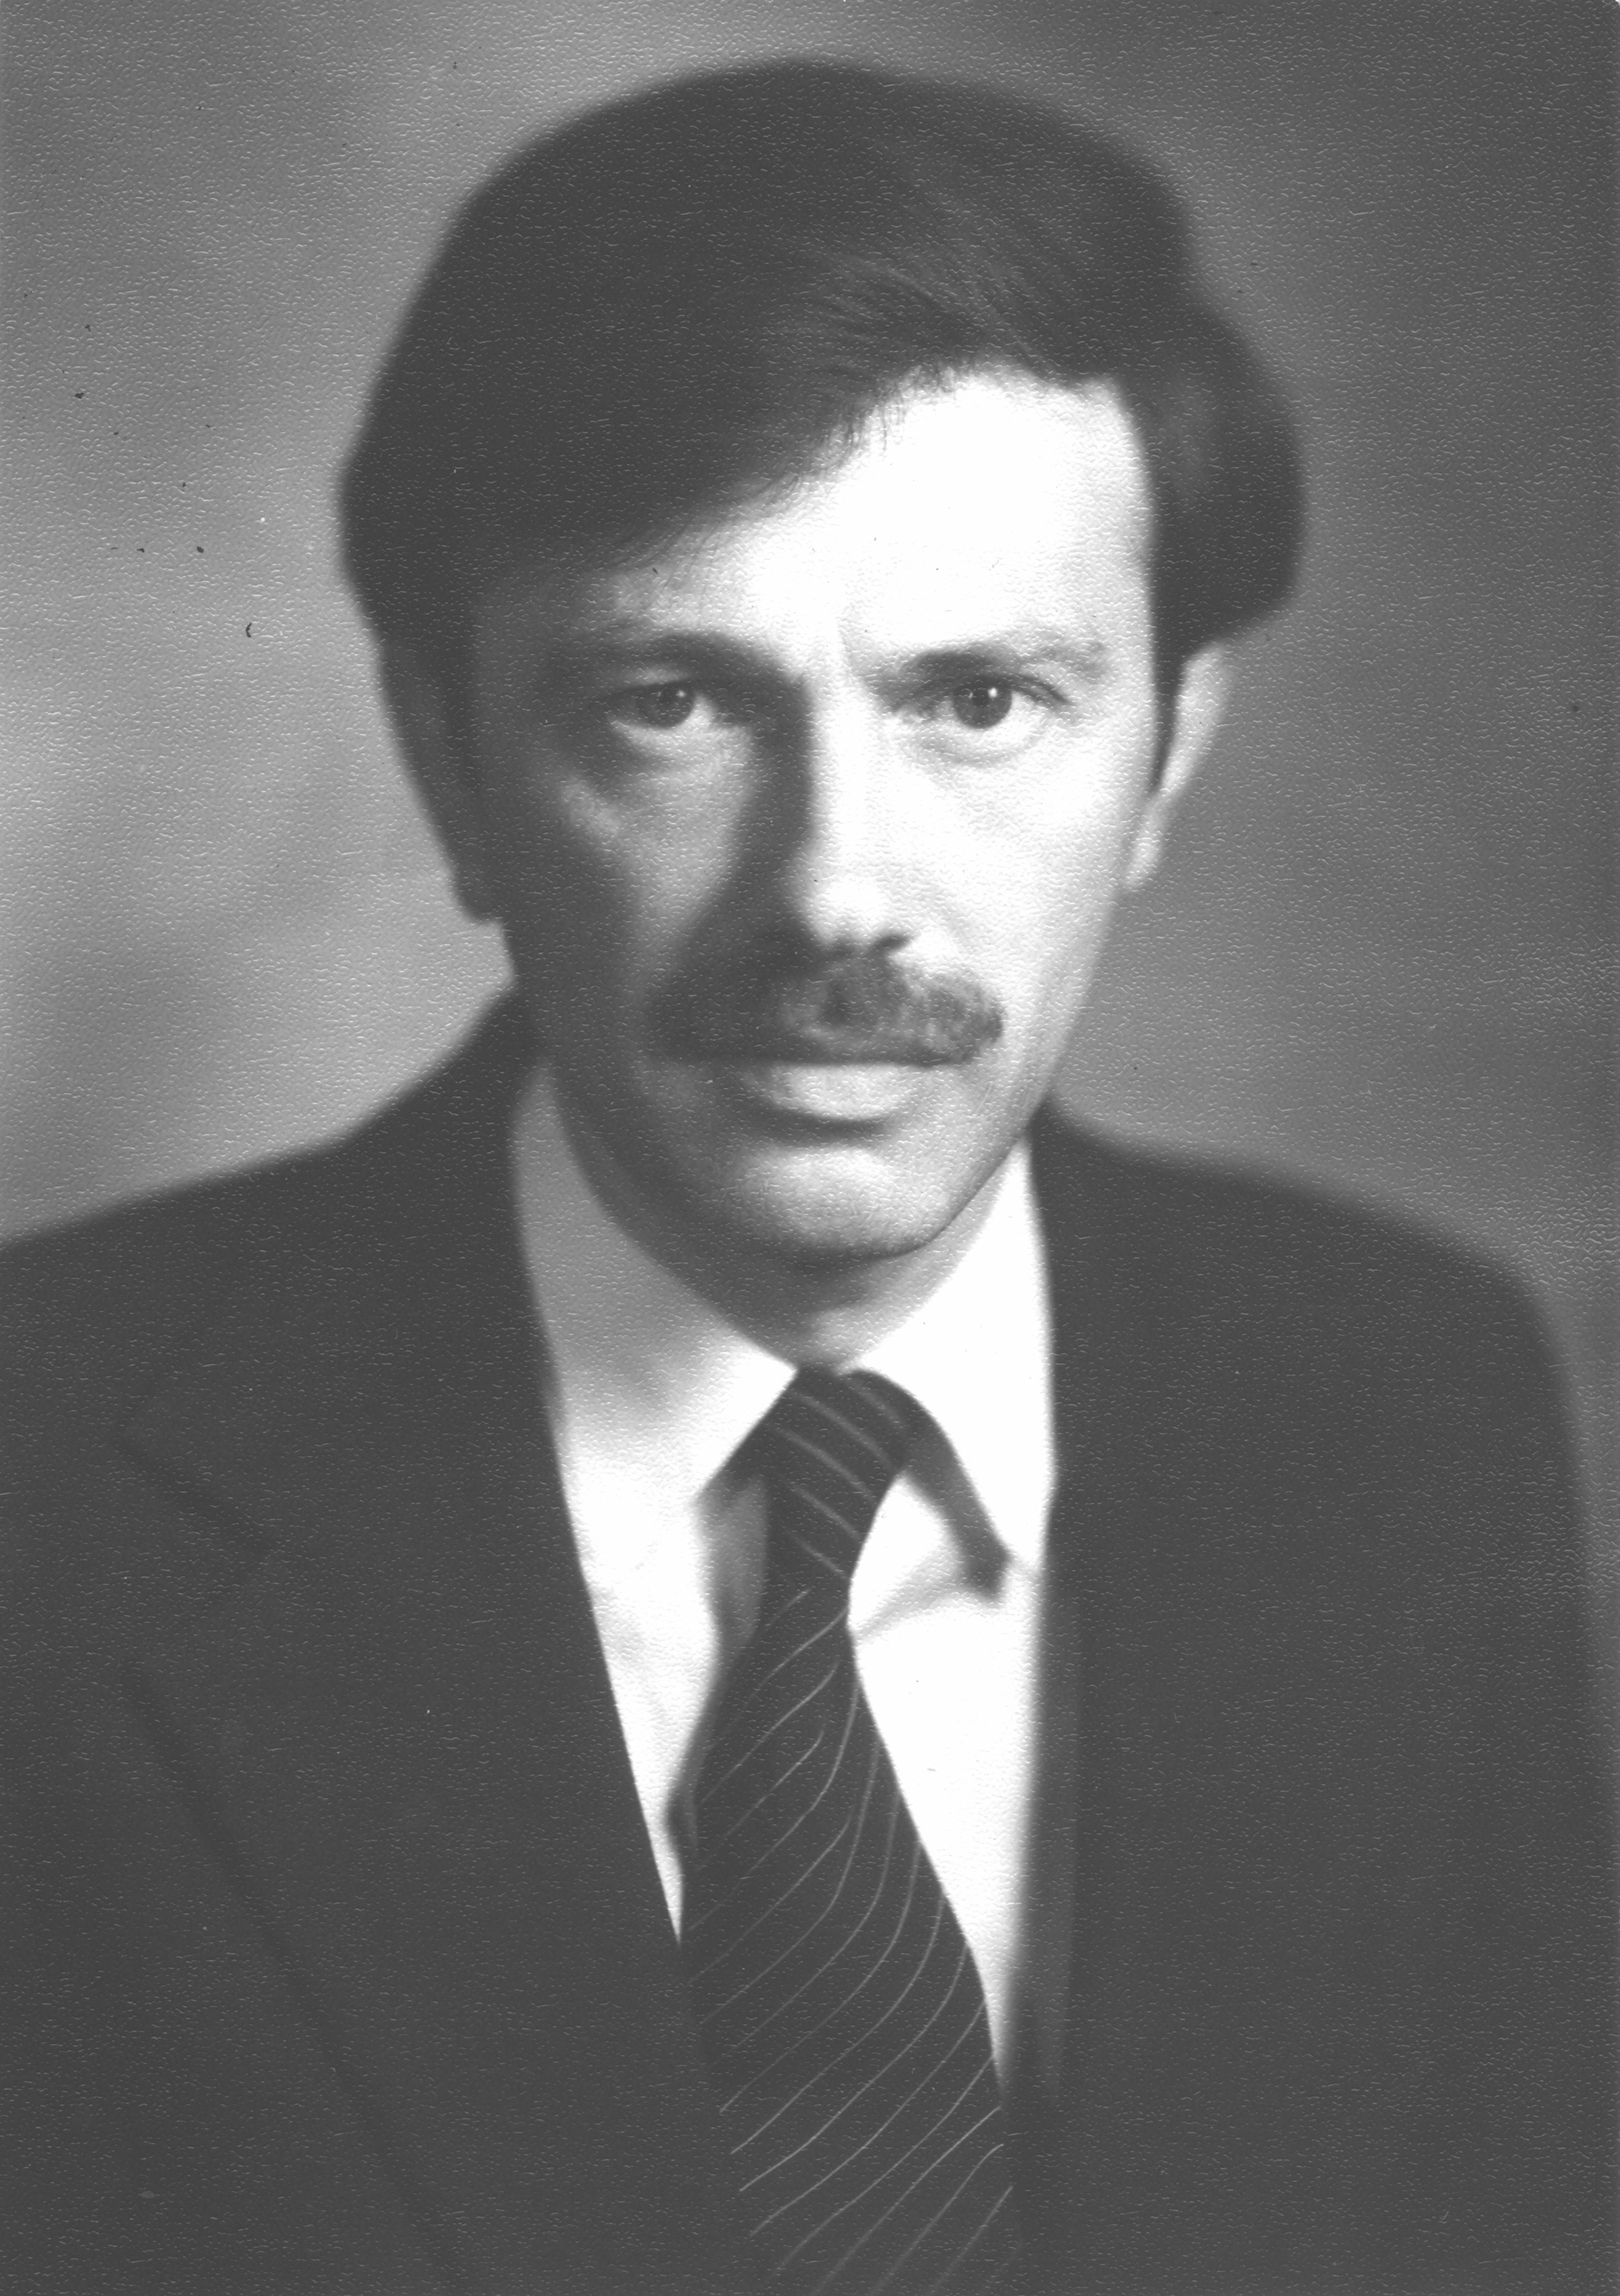
Grigory Domogatsky, 1980
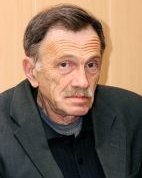
Later portrait
Published with the 2006 Markov Prize announcement; photograph date unspecified.
Led the Baikal neutrino programme from 1980.
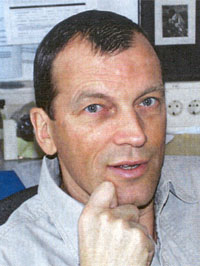
Christian Spiering
His Zeuthen group joined in 1988.
- Scientists, engineers and winter expeditions turned the proposal into a working array.
- The 2006 Markov Prize recognised Domogatsky and Spiering for NT200+ and high-energy neutrino astrophysics.
NT36, 1993
Three strings and 36 optical modules at Lake Baikal.
“Congratulations for winning the 3-string race!”
Francis Halzen to Christian Spiering
NT36, DUMAND’s TRIAD and AMANDA: competing routes to a working array.
Atmospheric neutrinos demonstrated that Markov’s method worked in a lake.
C. Spiering, historical review (2024), slides 29–31; Baikal detector paper.
The path to a cubic kilometre
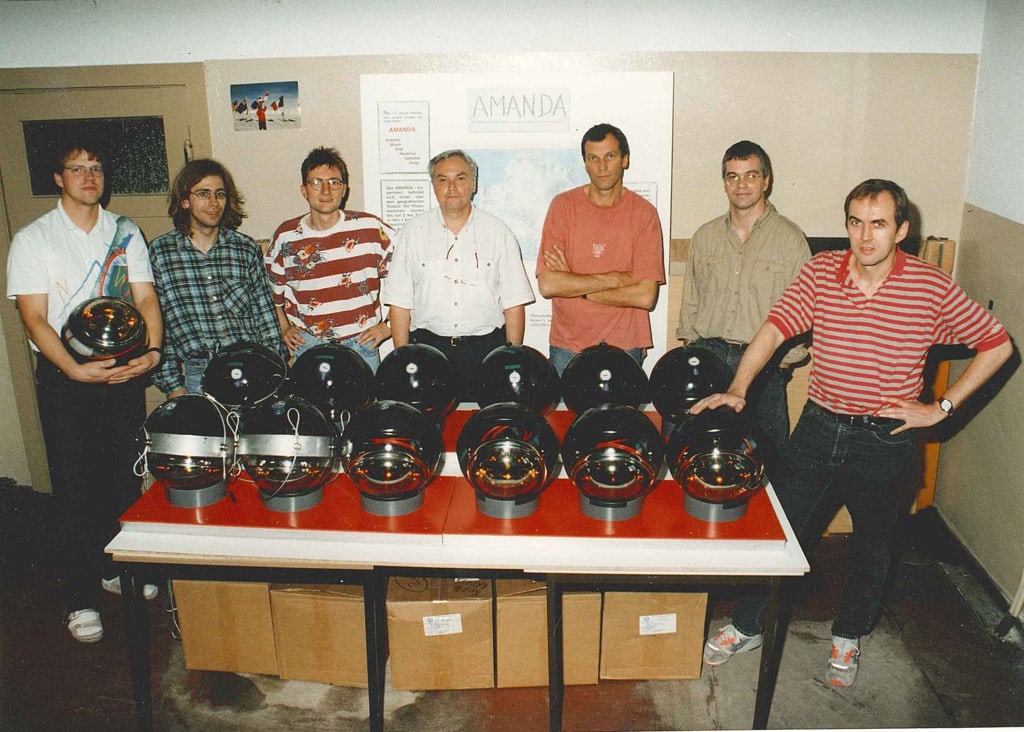
AMANDA collaborators and optical modules. AMANDA Collaboration; photograph undated.
Halzen, Learned, Price, Morse, Barwick and colleagues explored polar ice.
- Early shallow deployments suffered strong scattering from bubbles.
- Deeper ice made directional reconstruction possible.
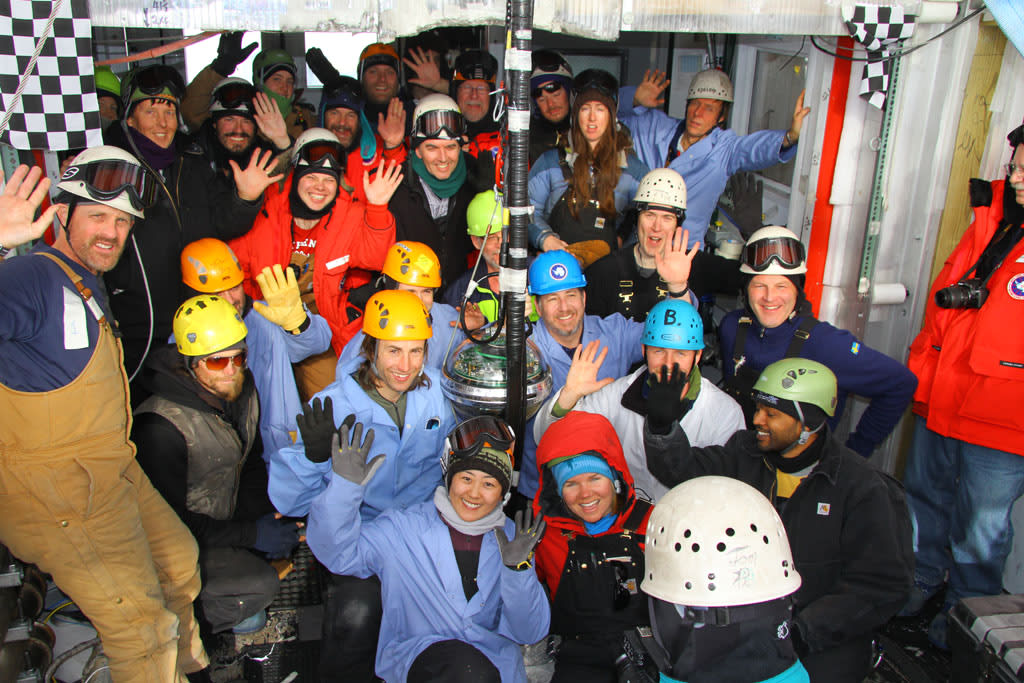
Final optical module, December 2010. IceCube/NSF, via the IceCube timeline.
1999: the cubic-kilometre proposal.
2010: the last of 86 strings.
2013: an astrophysical neutrino flux.
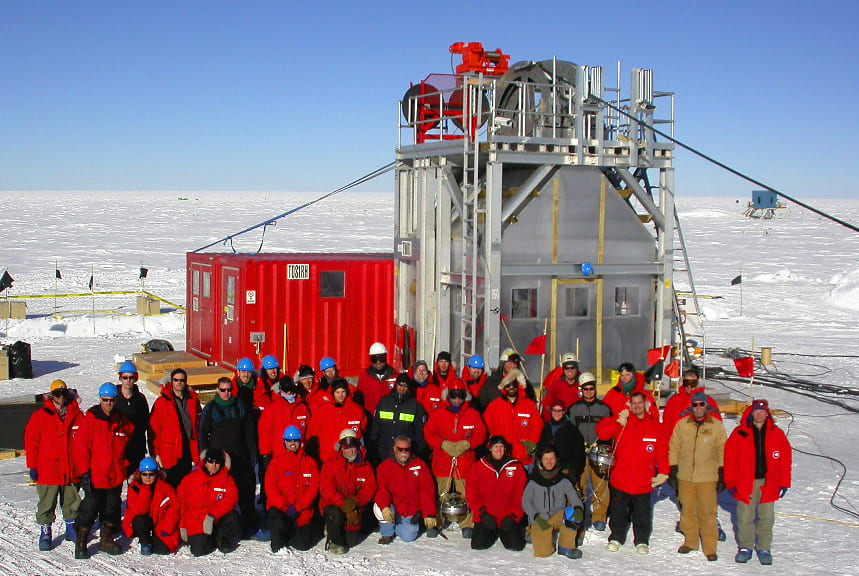
First IceCube construction season, 2004–2005. IceCube/NSF historical archive.
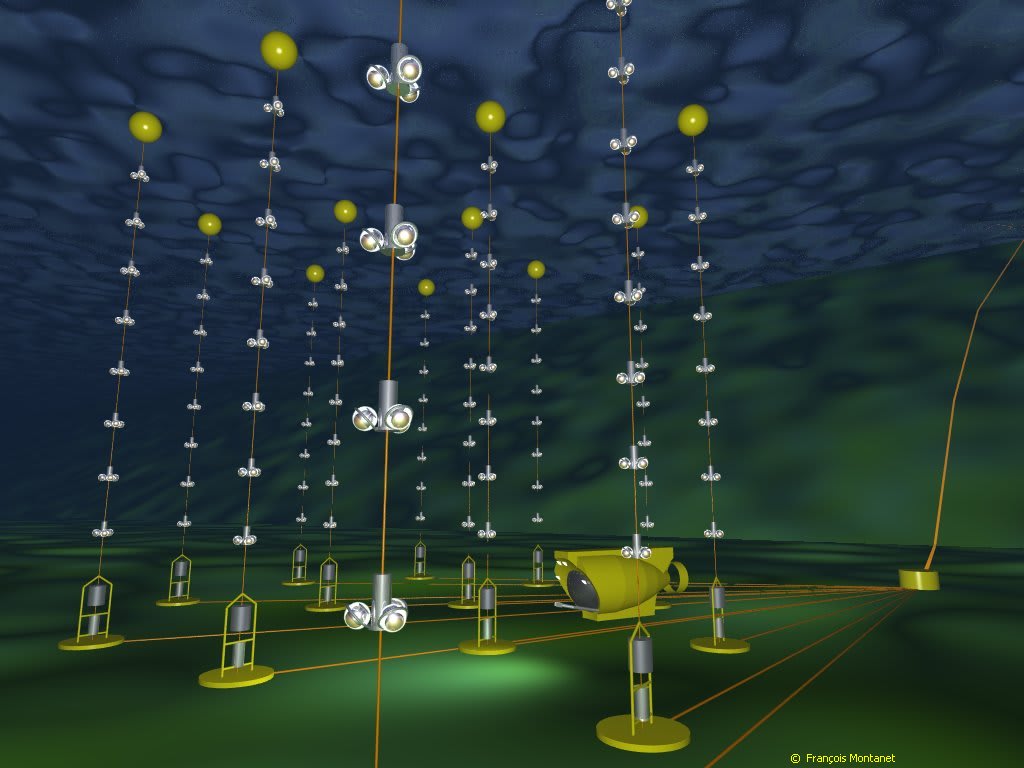
Artist’s illustration of ANTARES and Nautile. ANTARES material via IceCube.
2008: the 12-line detector is complete.
- Long-term operation demonstrated precision neutrino detection in the deep sea.
- ANTARES, NEMO and NESTOR supplied experience for KM3NeT.
Transparent Universe, opaque Earth
A \(1\,\mathrm{PeV}\) muon neutrino in today’s mean baryonic matter
\[ \bar n_{b,0}\simeq0.25\,\mathrm{m^{-3}} =2.5\times10^{-7}\,\mathrm{cm^{-3}} \]
\[ \sigma_{\nu N}^{\mathrm{CC+NC}} \simeq9.5\times10^{-34}\,\mathrm{cm^2} \]
About one nucleon per four cubic metres.
\[ \lambda_{\nu N,0}=\frac{1}{\bar n_{b,0}\sigma_{\nu N}} \simeq4.2\times10^{39}\,\mathrm{cm} \]
\[ \lambda_{\nu N,0}\simeq4.4\times10^{21}\,\mathrm{ly} \]
Observable diameter today: \(D_{\rm obs}\simeq93\times10^9\,\mathrm{ly}\).
\[ \frac{\lambda_{\nu N,0}}{D_{\rm obs}}\simeq5\times10^{10} \]
Present-epoch \(\nu N\) estimate ignoring the Universe evolution. PDG baryon density; CSMS cross sections, Table I.
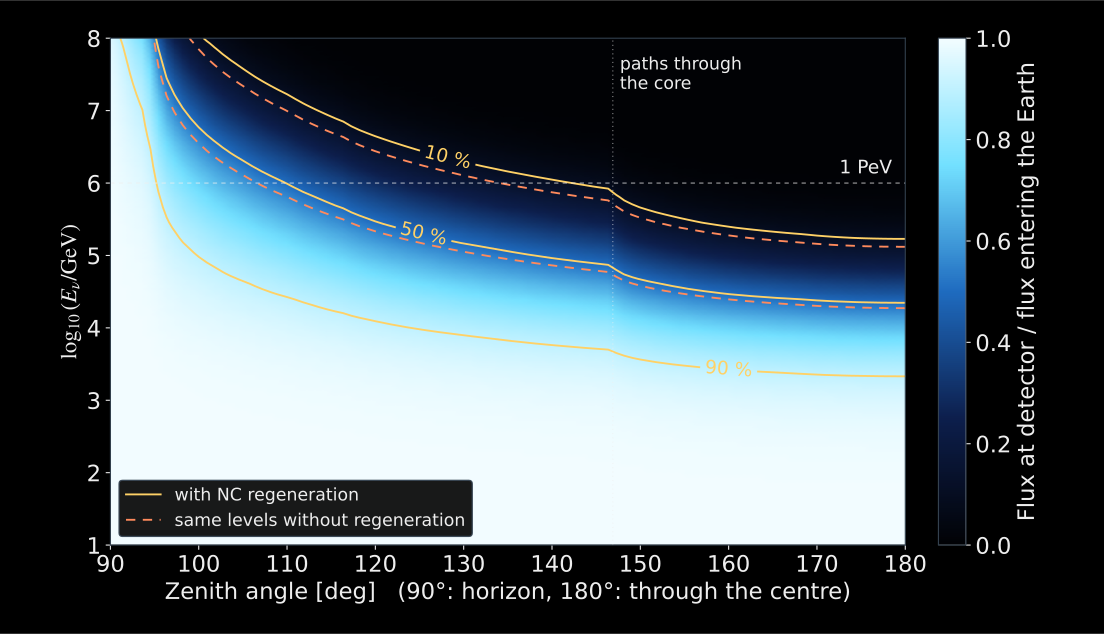
Full transport: V. A. Allakhverdyan (CT10nlo, PREM, detector 1 km deep), redrawn · V. A. Allakhverdyan, dissertation (2026), Fig. 4.20 · Allakhverdyan, Zavyalov & Naumov (2026), Fig. 9
\[ 1\,\mathrm{PeV}=10^6\,\mathrm{GeV} \]
Horizontal axis: zenith angle.
\(90^\circ\): near the horizon.
\(180^\circ\): through Earth’s centre.
Colour: flux at the detector over flux entering the Earth.
Dashed: without regeneration,
\[ e^{-N_A\,\sigma_{\rm tot}(E)\,X(\theta)}. \]
Neutral currents do not remove a neutrino; they move it to lower energy. With regeneration the ratio depends on the incident spectrum.
\[ \lambda_{\nu N}(\rho)=\frac{1}{N_A\rho\sigma_{\nu N}} \simeq3.2\times10^3\,\mathrm{km} \left(\frac{5.5\,\mathrm{g\,cm^{-3}}}{\rho}\right). \]
Earth’s diameter is \(12742\,\mathrm{km}\); its dense core matters.
\[ X_{\rm diam}=\int_{\rm diameter}\rho(\ell)\,d\ell \simeq1.1\times10^{10}\,\mathrm{g\,cm^{-2}} \quad\text{(PREM)}. \]
\[ \tau_{\rm diam}=N_A\sigma_{\nu N}X_{\rm diam}\simeq6.3, \qquad P_0=e^{-\tau_{\rm diam}}\simeq1.8\times10^{-3}\simeq0.2\%. \]
- Almost no PeV neutrinos cross the full diameter without interacting.
- Near the horizon, the path is much shorter.
\(P_0\): zero CC or NC interactions, not the regenerated flux fraction \(\mathcal T\). PREM column depth: Gandhi et al.
One year of IceCube up-going muons weighs the Earth
- IC86, 2011–2012: 20 145 up-going muons, 0.4–20 TeV; the zenith distribution follows absorption in the Earth.
- Earth’s mass: \(M_\oplus^\nu=6.0^{+1.6}_{-1.3}\times10^{24}\,\mathrm{kg}\); gravity gives \(5.9722\times10^{24}\,\mathrm{kg}\).
- Core mass: \(M_{\rm core}^\nu=2.72^{+0.97}_{-0.89}\times10^{24}\,\mathrm{kg}\).
- Moment of inertia: \((6.9\pm2.4)\times10^{37}\,\mathrm{kg\,m^2}\); gravity gives \(8.017\times10^{37}\).
- The core is denser than the mantle: a denser mantle has \(p=0.011\).
Weak interactions alone, without gravity, see the Earth’s dense core.
68% credible intervals, default atmospheric-flux model · A. Donini, S. Palomares-Ruiz, J. Salvado, Nature Physics 15, 37 (2019), arXiv:1803.05901
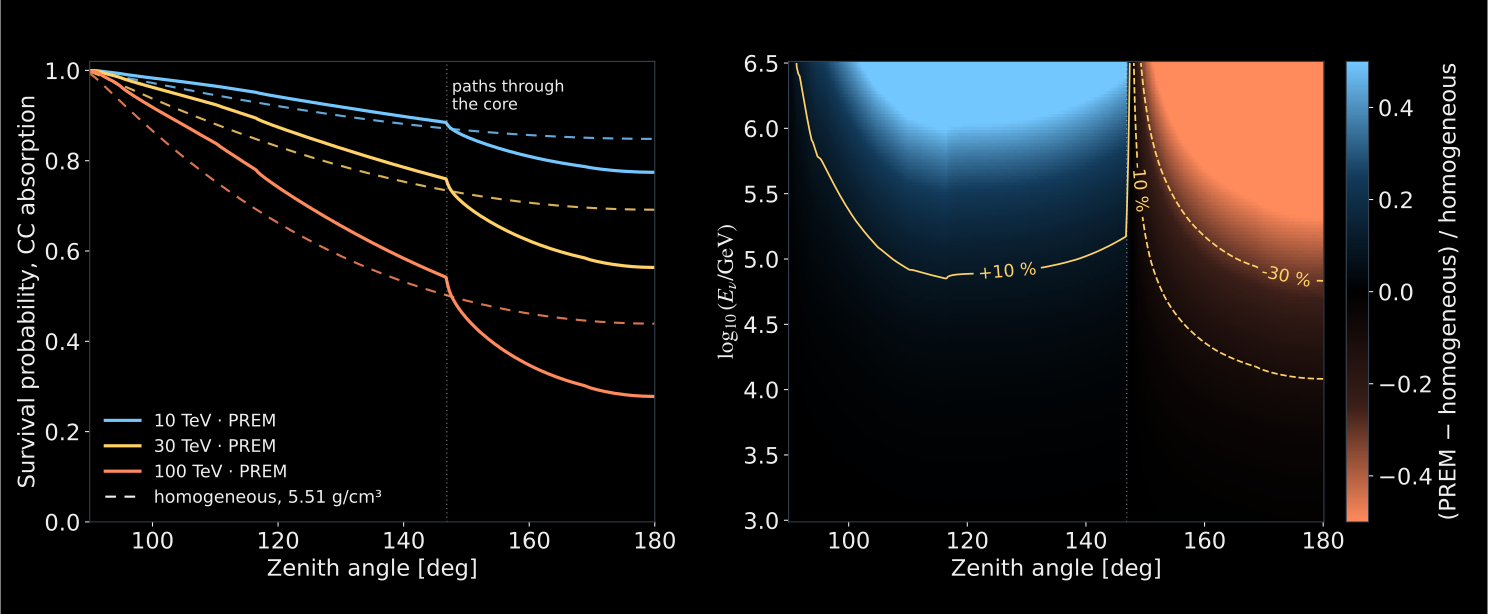
- Same mass, different profile: PREM against a homogeneous Earth of \(5.51\,\mathrm{g\,cm^{-3}}\).
- Paths through the core (beyond \(147^\circ\)) lose \(\sim20\%\) more neutrinos at \(30\,\mathrm{TeV}\); mantle paths lose fewer.
Computed: PREM, CSMS cross sections, detector 1 km deep · CC absorption only; NC and \(\tau\) regeneration not included
Tracks and cascades
A track — KM3NeT
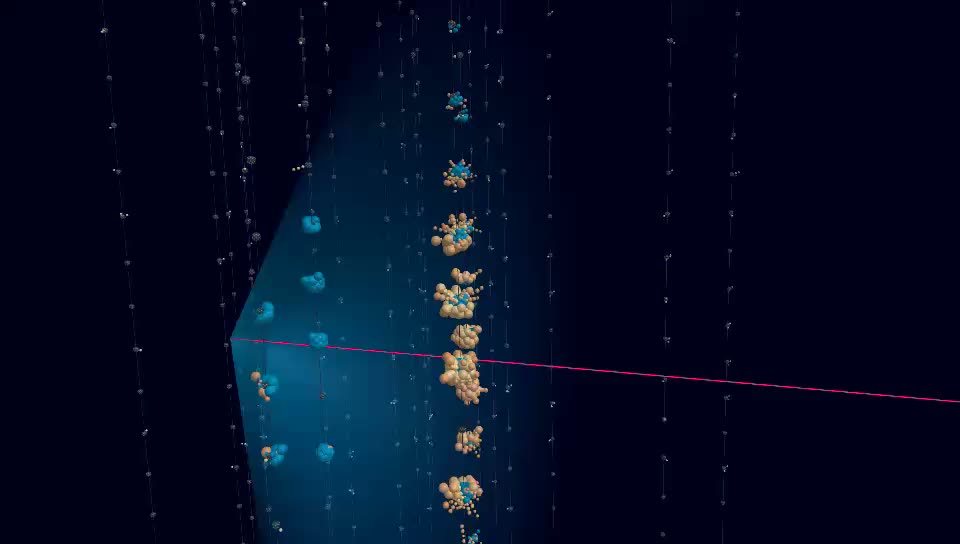
A long muon path through the array.
KM3NeT Collaboration, KM3-230213A.
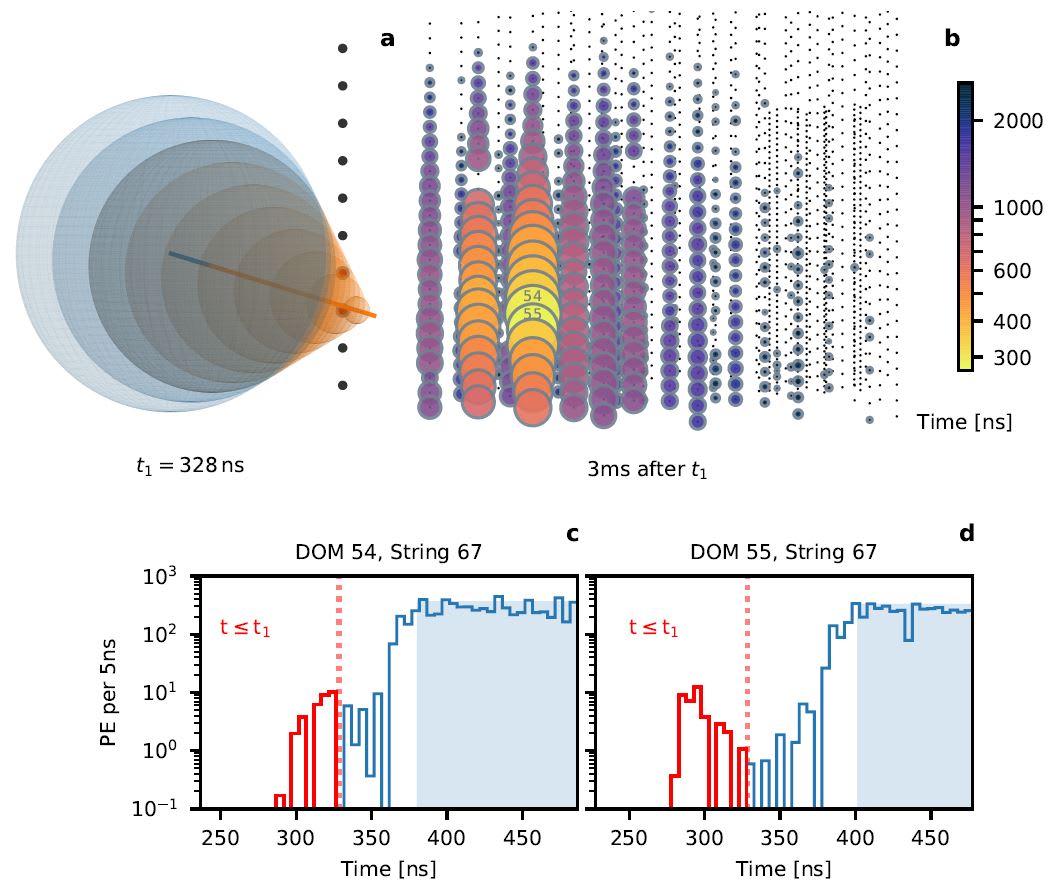
A cascade — IceCube
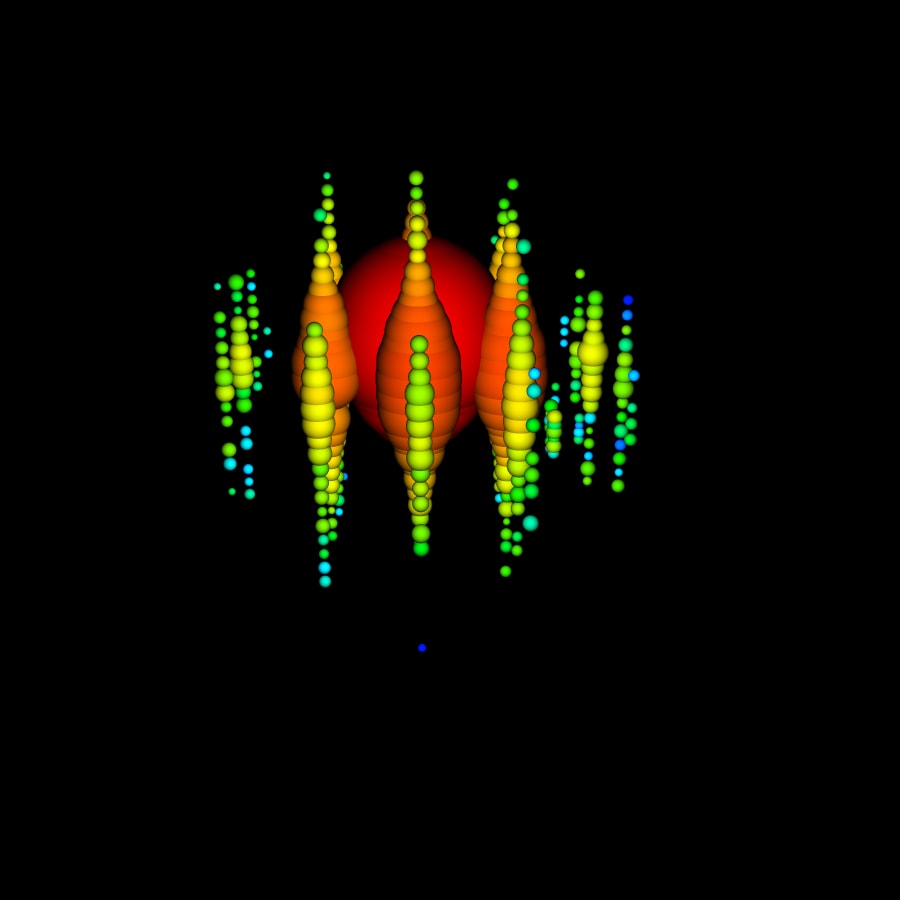
A compact shower compared with module spacing.
IceCube Collaboration / IceCube–NSF, Big Bird.
Measured PMT signals; reconstructed track; illustrative cone. © KM3NeT. Official event display.
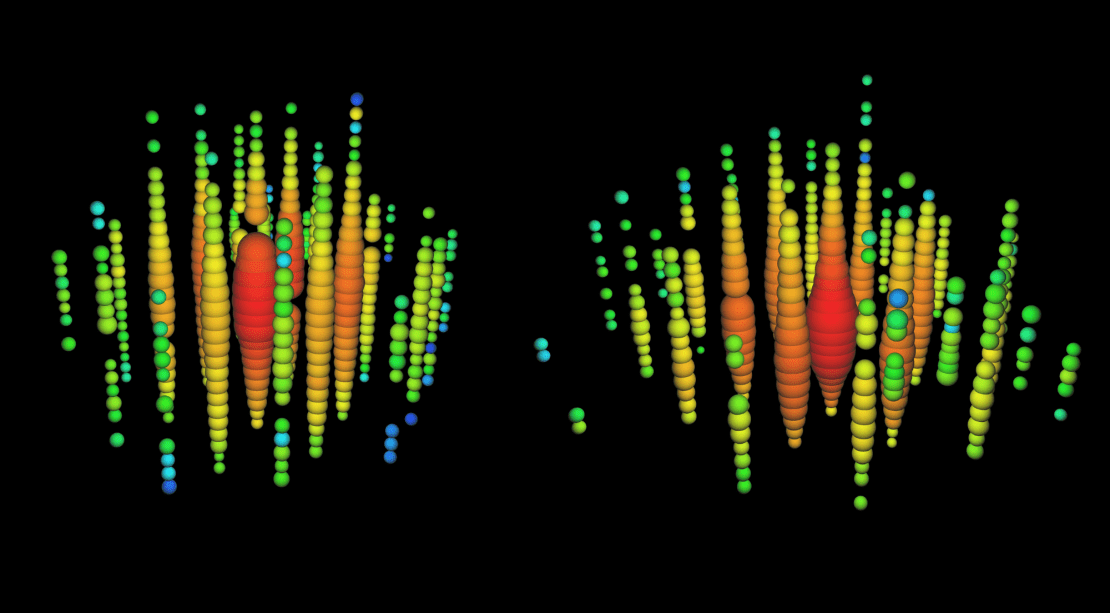
Bert and Ernie, the first PeV cascades: deposited energies \(1.04\pm0.16\) and \(1.14\pm0.17\,\mathrm{PeV}\). IceCube Collaboration / IceCube–NSF · IceCube (2013)
Muon-neutrino interaction, 1 TeV · NTSim/Geant4 secondaries, LightHit radiative transfer in water · glow = expected photoelectrons, colour = first-light time · not sampled hits, not observed data · light front illustrative
Electron-neutrino interaction, 100 GeV · NTSim/Geant4 secondaries, LightHit radiative transfer in water · glow = expected photoelectrons, colour = first-light time · not sampled hits, not observed data · light front illustrative
How jets produce neutrinos
Scenario and calculation: Barkov, Aharonian & Bosch-Ramon (2010) · The film illustrates the idea: simplified gas model, schematic protons and neutrinos
Accelerated protons collide with nuclei in dense gas.
\[ pp\longrightarrow\pi^{\pm},\,\pi^0+X \]
Possible targets: a stripped stellar envelope or a gas cloud in the jet.
The gas density and the proton residence time control the interaction yield.
Accelerated protons interact with a radiation field.
\[ p\gamma\longrightarrow\pi^{\pm},\,\pi^0+X \]
Possible targets: synchrotron photons in the jet, or photons from the accretion disc and its surroundings.
The pion-production threshold depends on photon energy and collision angle.
The jet supplies energy. The star creates a shock and a dense target.
\[ r_L=\frac{p}{ZeB}\lesssim R \]
- A source must retain particles long enough to accelerate them.
- Energy losses and the available time also limit the maximum energy.
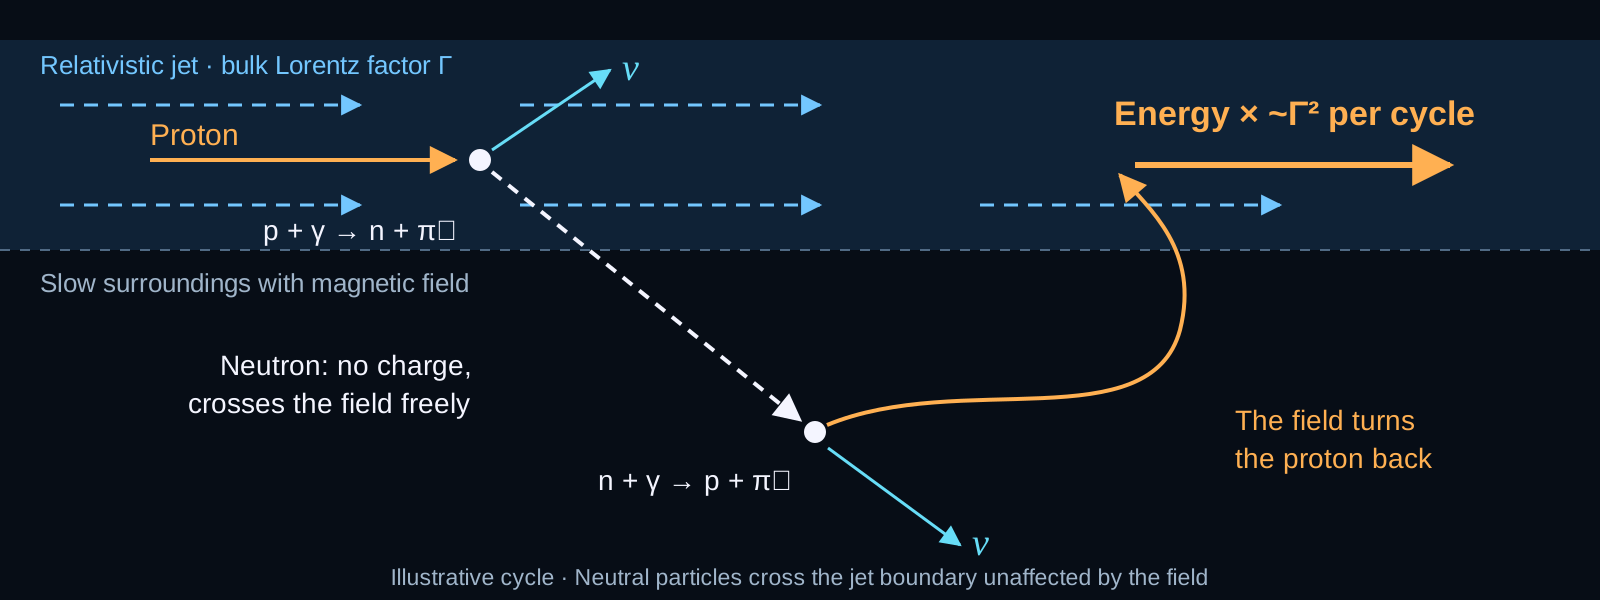
Charge changes let particles cross the field · Gain \(\sim\Gamma^2\) per cycle · Derishev et al. (2003)
Three messengers, one energy budget
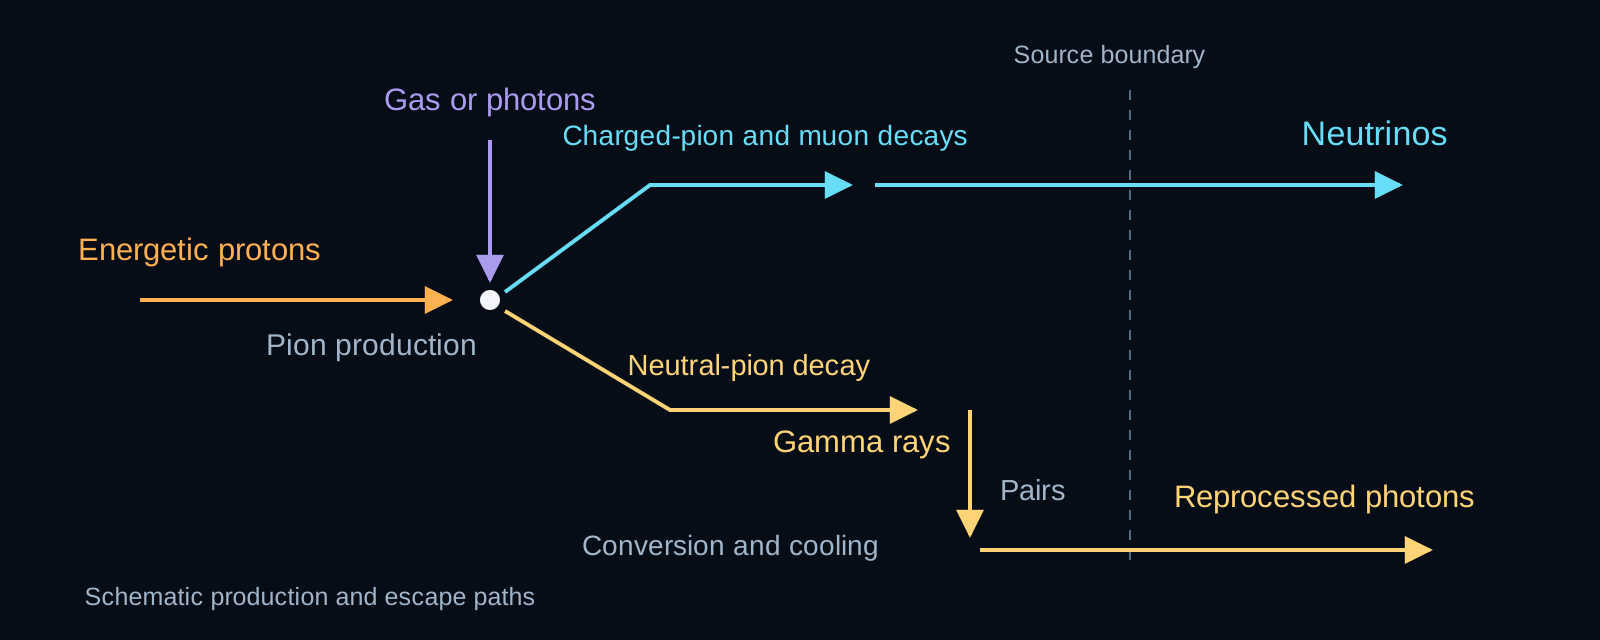
Gamma rays, neutrinos and the most energetic cosmic rays carry similar power.
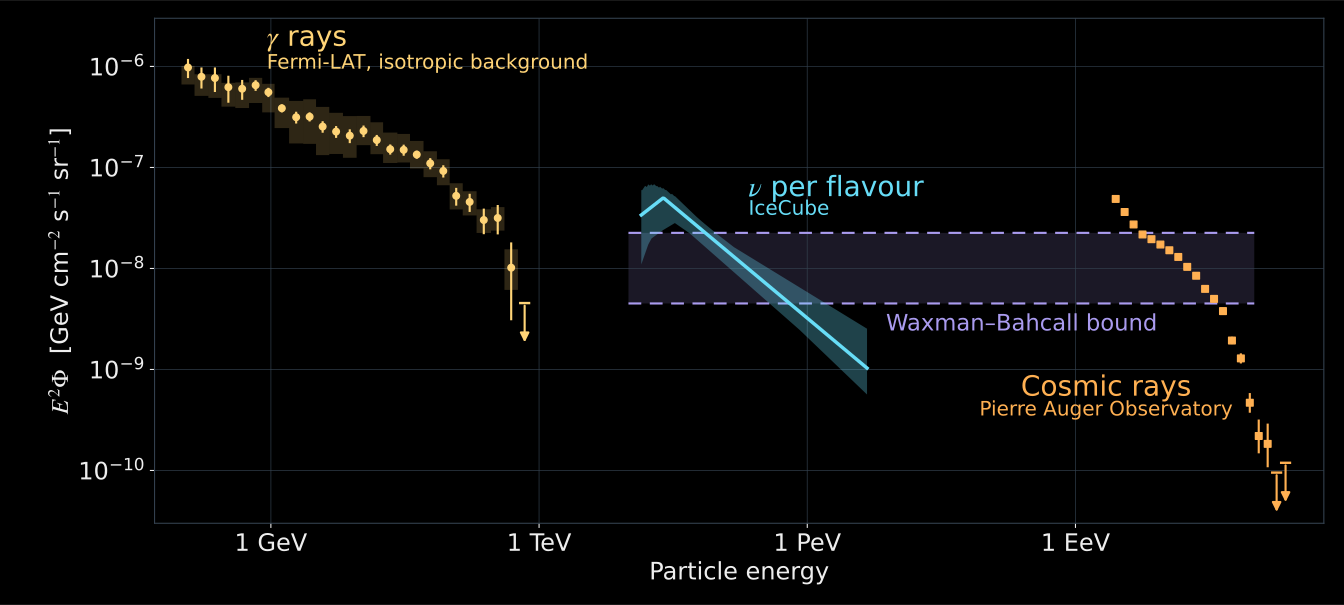
Neutrinos per flavour · Fermi-LAT (2015) · IceCube (2026), band digitized from Fig. 3 · Auger (2020) · Bound: Waxman & Bahcall (1999)
The astrophysical neutrino flux
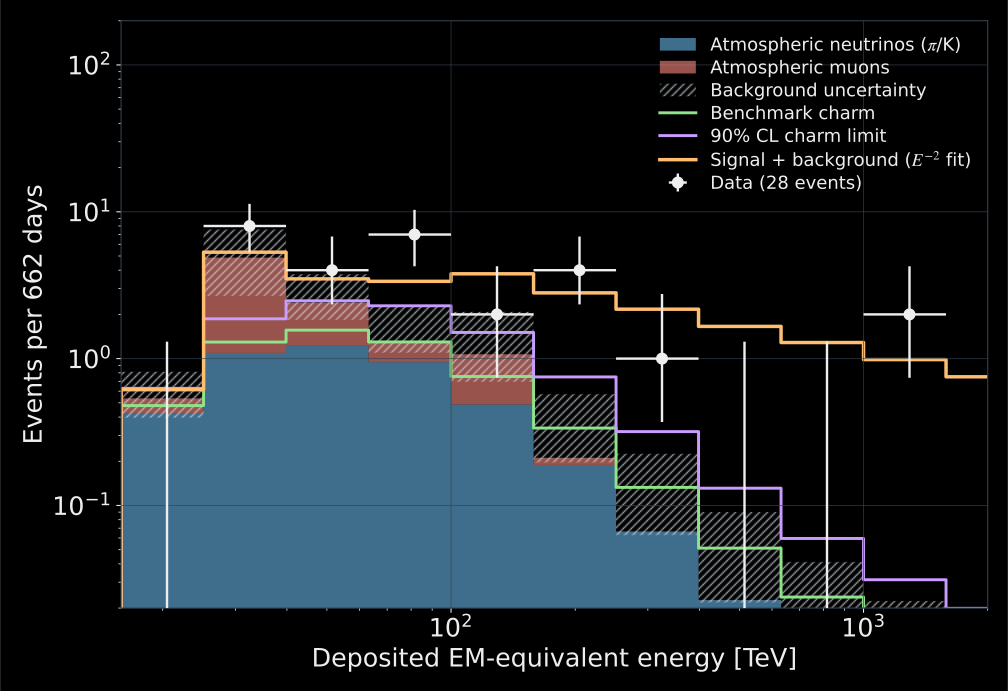
28 events · 662 live days
\[30–1200\,\mathrm{TeV}\]
Deposited energy.
White points: data.
Blue + red: atmospheric backgrounds.
Orange: signal + background.
\[4.1\sigma\]
Benchmark atmospheric hypothesis.
2010–2012 sample and fitted spectrum · Redrawn from the vector artwork of IceCube, Science (2013), Fig. 4
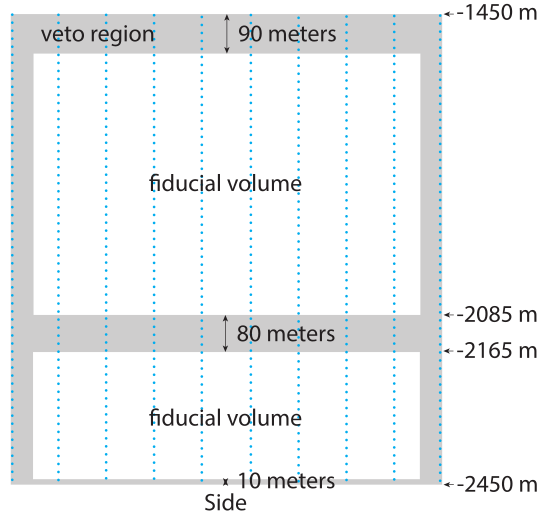
Entering muon: early light at the boundary.
Contained interaction: first light inside.
Atmospheric neutrinos can arrive with muons from the same air shower.
Veto and fiducial volume · IceCube (2013), Fig. 1, side view
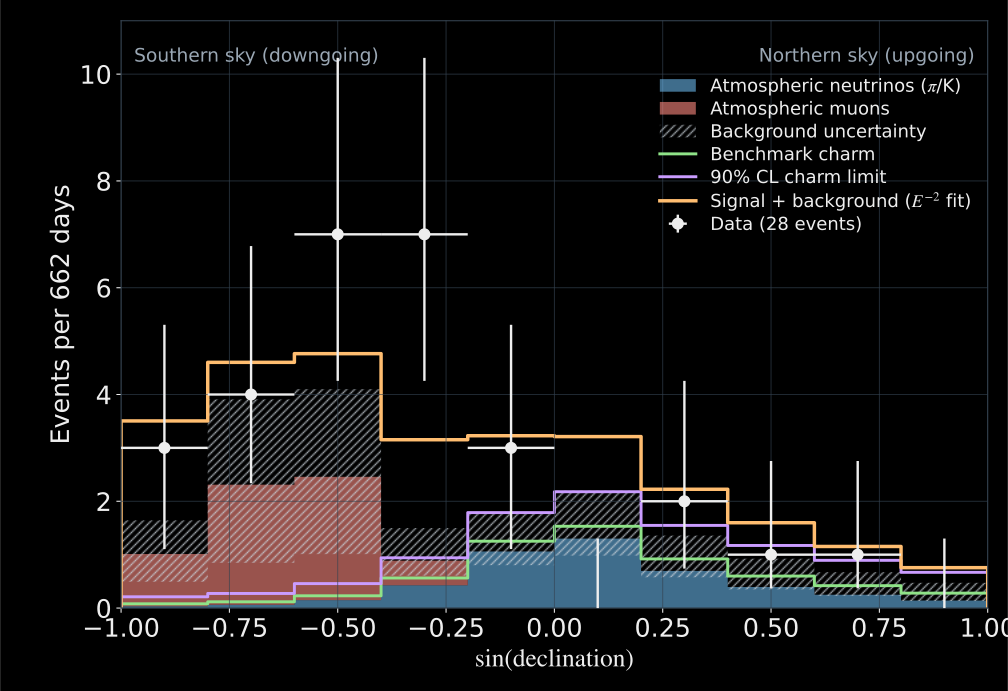
Direction, energy and veto response constrain the background hypothesis together. · Redrawn from the vector artwork
An independent measurement with Baikal-GVD
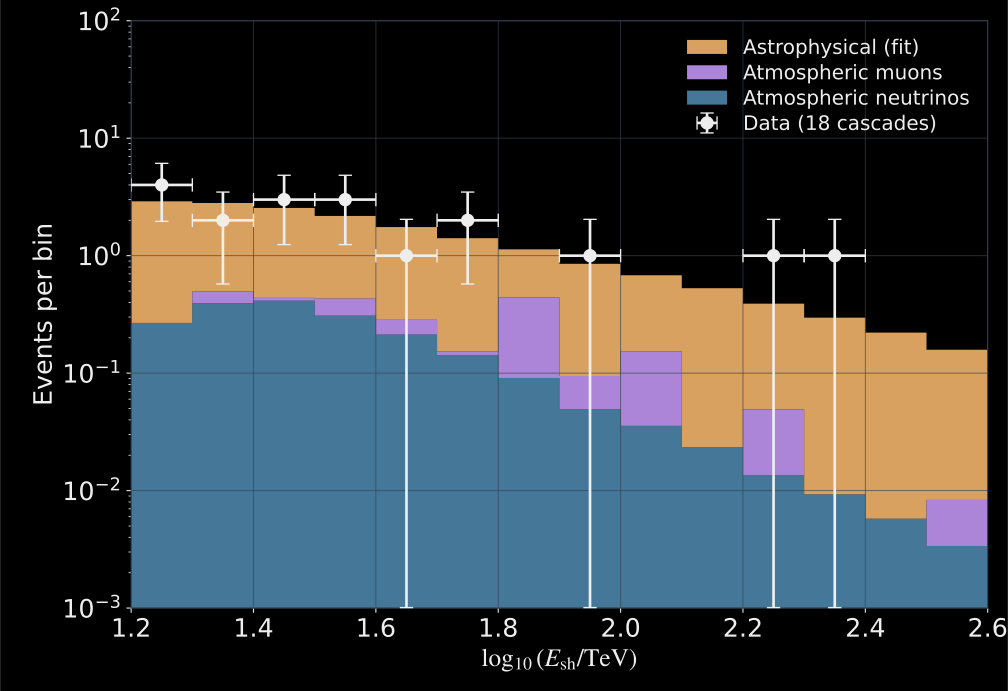
April 2018–March 2024
18 upward-going cascades
\[E_{\mathrm{sh}}>15\,\mathrm{TeV}\]
Expected atmospheric background:
\[2.8\pm1.0\ \text{events}\]
\[5.1\sigma\]
Points: data · Stacked: fitted signal and backgrounds · Digitized from Baikal-GVD (2025), Fig. 2
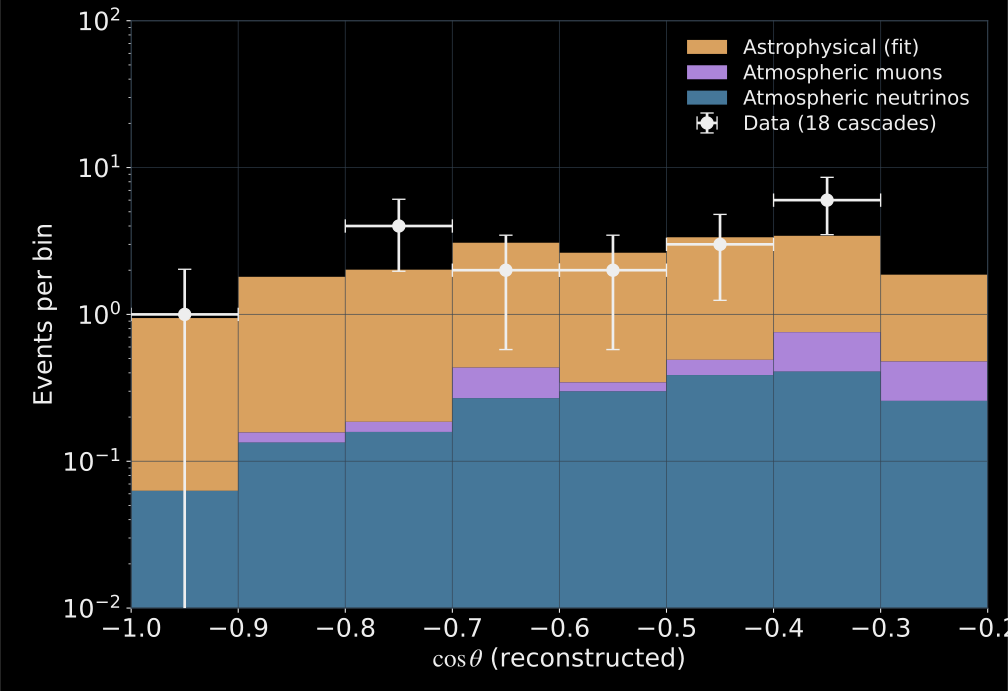
Same selected sample · \(\cos\theta<-0.25\), additional quality cuts · Baikal-GVD, Fig. 2 · Digitized from the original
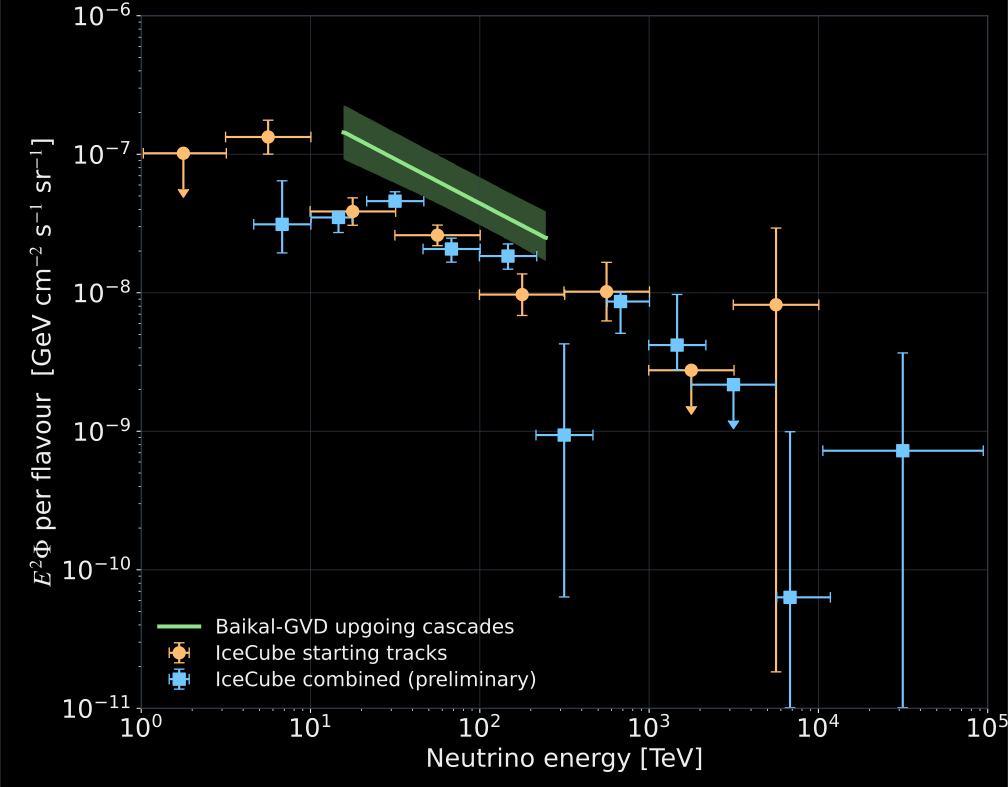
Per flavour, \(\nu+\bar\nu\) · Published 2025 comparison · Blue IceCube points are preliminary · Digitized from Fig. 4
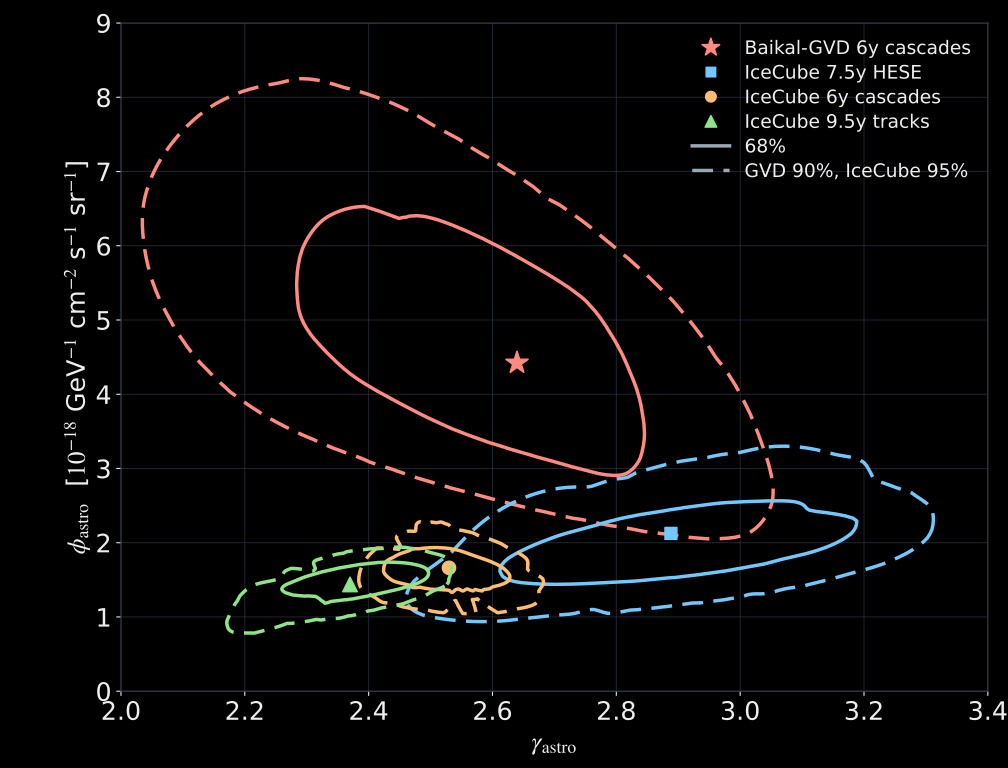
Single power law · Normalization at \(100\,\mathrm{TeV}\) per flavour · Different contour levels retained · Fig. 3 · Digitized from the original
Structure in the diffuse spectrum
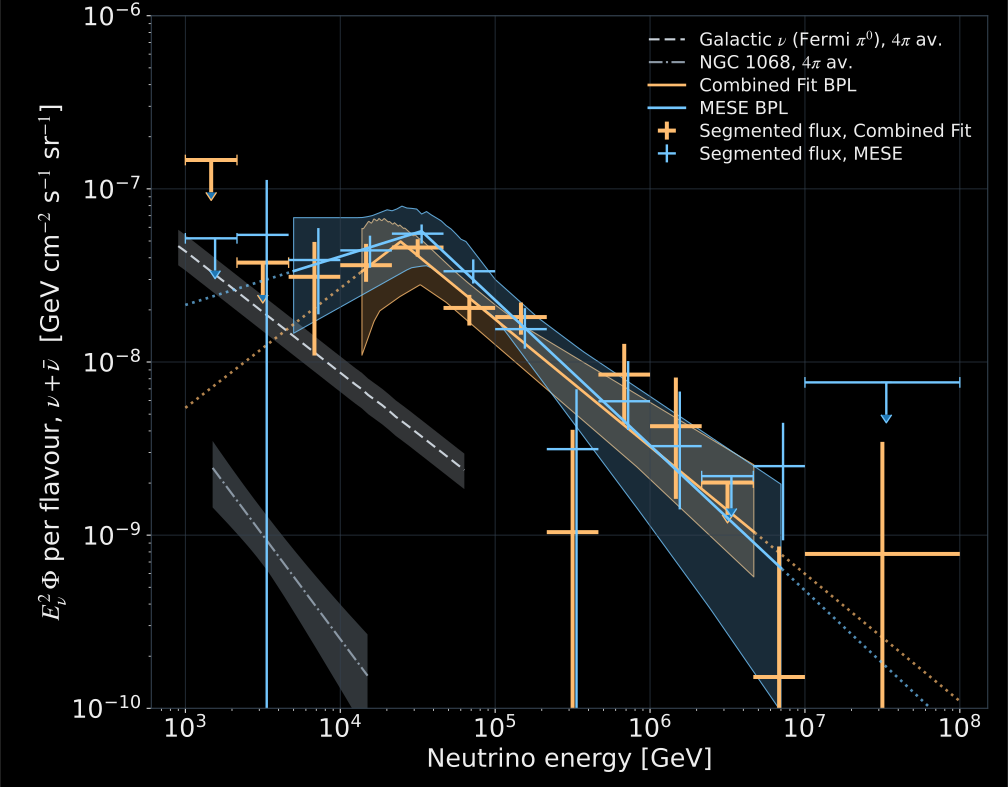
CF (orange): tracks + cascades.
MESE (blue): starting events.
Slope changes near
\[30\,\mathrm{TeV}.\]
Single power law disfavoured:
\[>4\sigma\]
Curvature is also tested.
Per flavour, \(\nu+\bar\nu\) · Segmented estimates and fitted bands · Redrawn from the vector artwork of IceCube, PRL (2026), Fig. 3
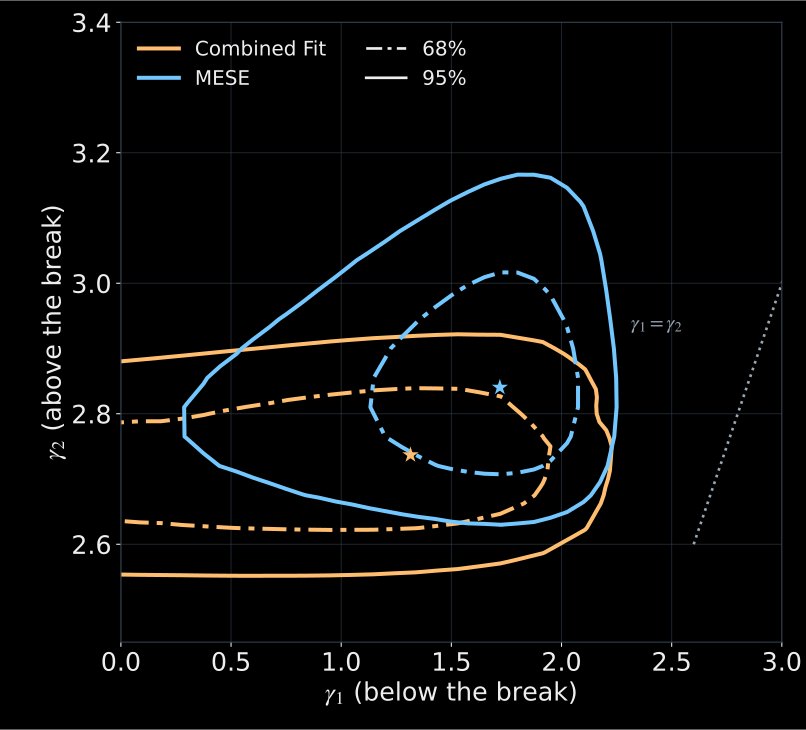
\(\gamma_1=\gamma_2\): single power law · \(68\%\) and \(95\%\) regions · Fig. 2 · Redrawn from the vector artwork
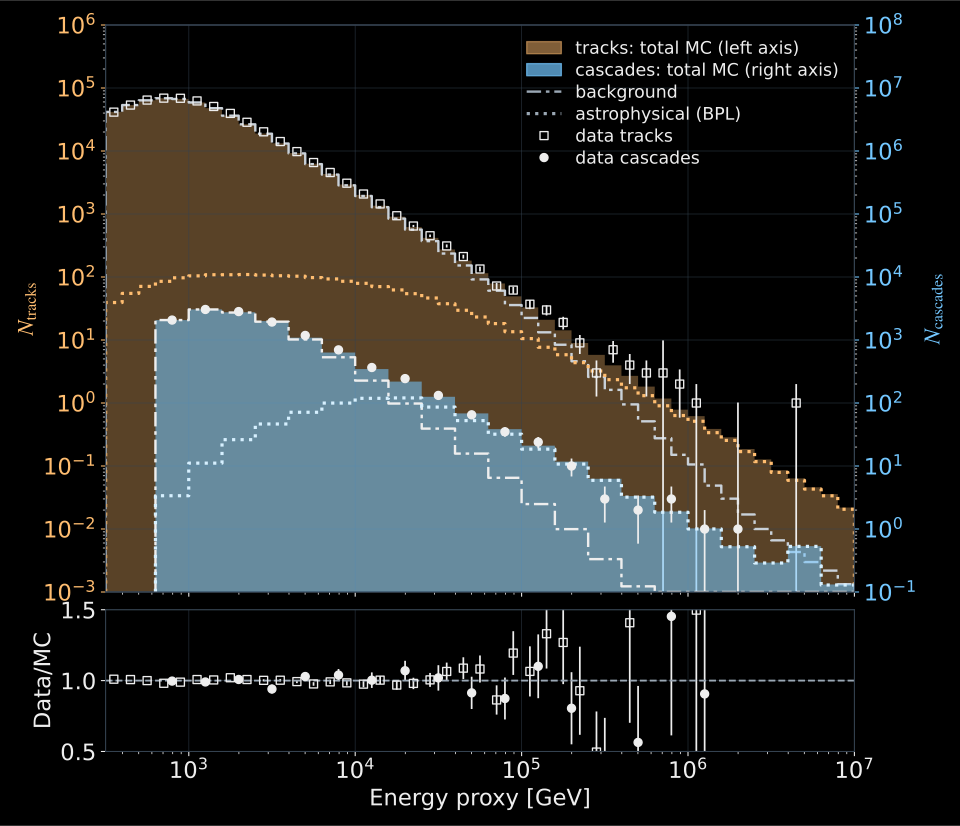
Reconstructed proxies and separate count axes · CF panel of Fig. 1 · Redrawn from the vector artwork
Glashow resonance
\[\bar\nu_e+e^-\to W^-\to\text{hadrons}\]
\[E_{\bar\nu}\simeq6.3\,\mathrm{PeV}\]
One shower, December 2016. Only antineutrinos can do this.
Tau neutrinos
Seven candidates: all three flavours arrive.
Why it matters
\(pp\): \(\ \bar\nu_e:\nu_e\approx1:1\)
simple \(p\gamma\): \(\ \approx1:3.5\)
The Milky Way in neutrinos
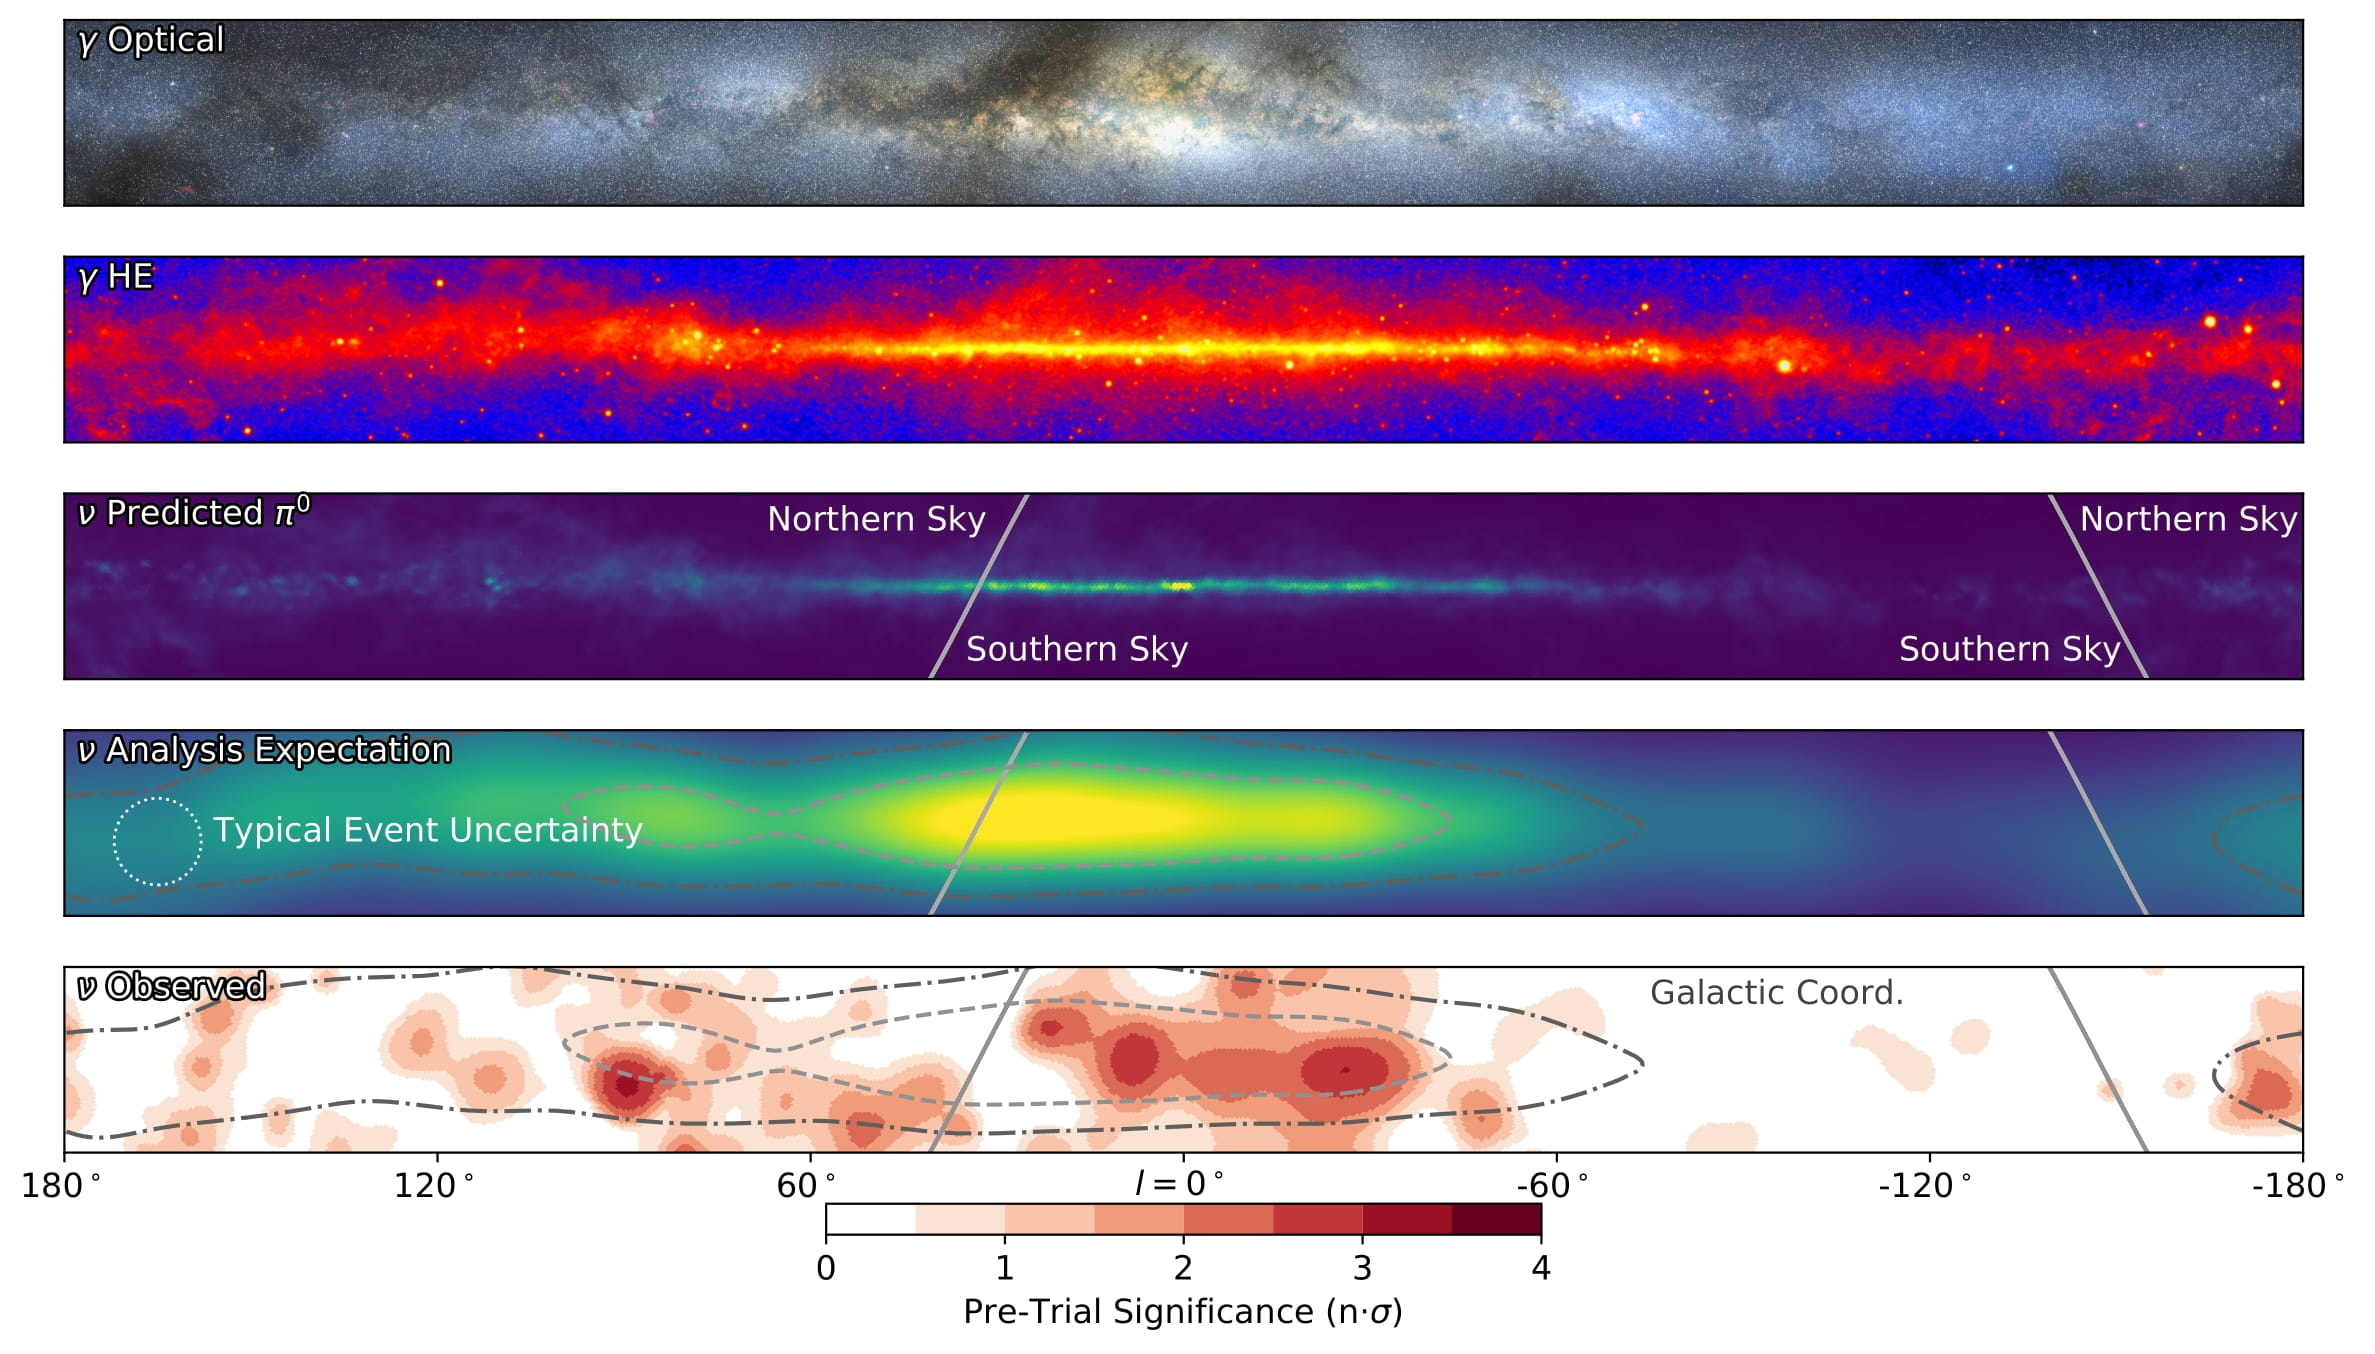
IceCube Collaboration, Science (2023) · Diffuse Galactic emission: \(4.5\sigma\)
ANTARES, 2023: a mild hint of TeV neutrinos from the inner Galactic ridge.
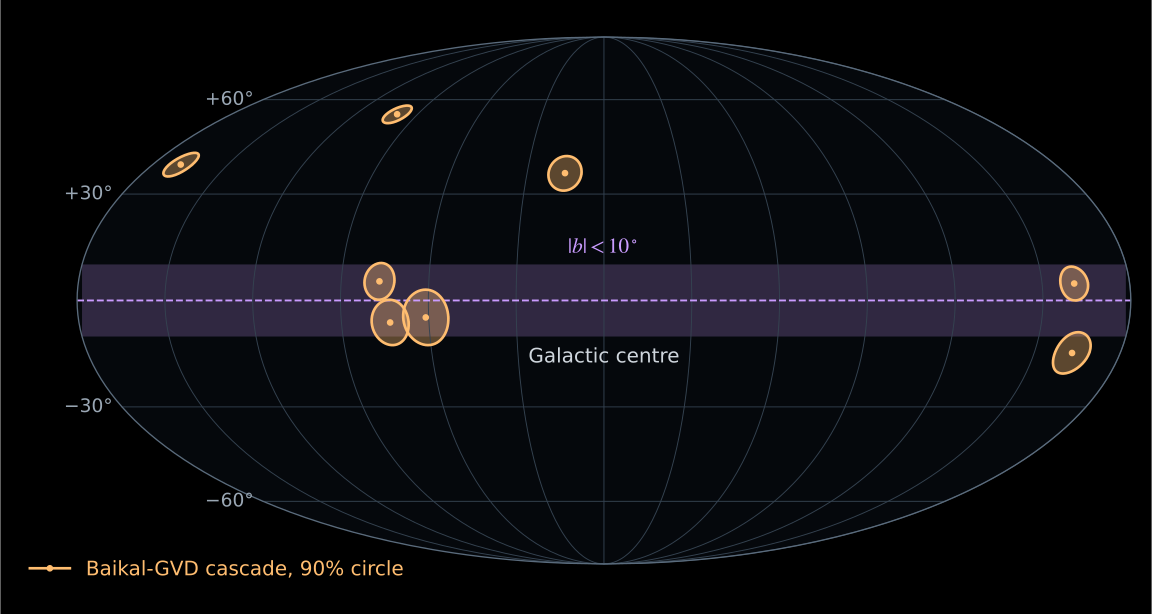
8 cascades above 200 TeV
They crowd towards the Galactic plane.
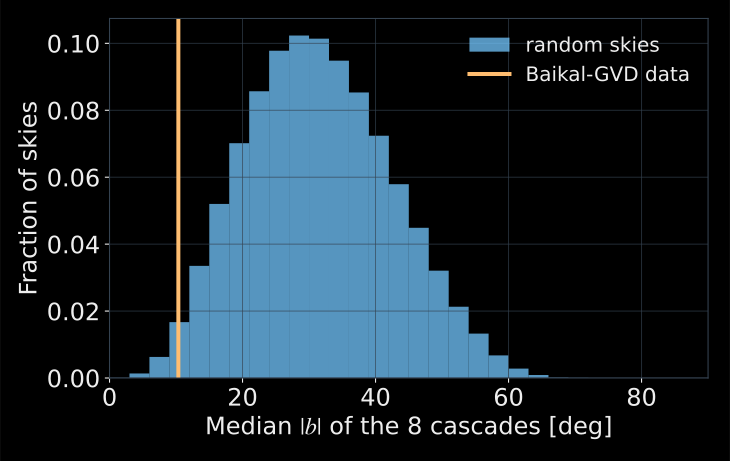
Baikal-GVD: \(p=1.4\times10^{-2}\)
With IceCube: \(p=3.4\times10^{-4}\)
V. A. Allakhverdyan et al. (Baikal-GVD) with Y. Y. Kovalev, A. V. Plavin, D. V. Semikoz, S. V. Troitsky · ApJ 982, 73 (2025) · Redrawn from Table 1; test of Fig. 1 recomputed
Model Galaxy (illustrative) · Baikal-GVD cascades above 200 TeV and the published shuffling test
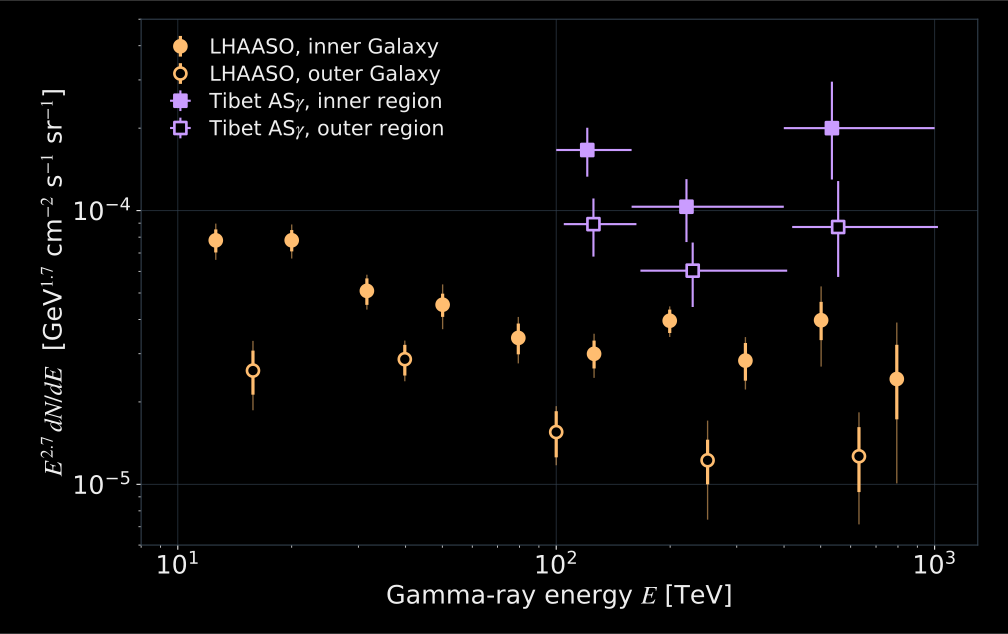
The same collisions
\[\pi^0\to\gamma\gamma,\qquad \pi^\pm\to\nu\ \ldots\]
The Galactic plane glows in gamma rays up to \(\sim1\,\mathrm{PeV}\).
Tibet AS\(\gamma\), 2021: first diffuse gamma rays above \(100\,\mathrm{TeV}\).
LHAASO, 2023: the spectrum from \(10\,\mathrm{TeV}\) to \(1\,\mathrm{PeV}\).
Redrawn: LHAASO, PRL 131, 151001 (2023), Tables S2–S3 · Tibet AS\(\gamma\), PRL 126, 141101 (2021), digitized from Fig. 4 · Different sky regions and source masks
Neutrino spectra and the gamma-ray budget
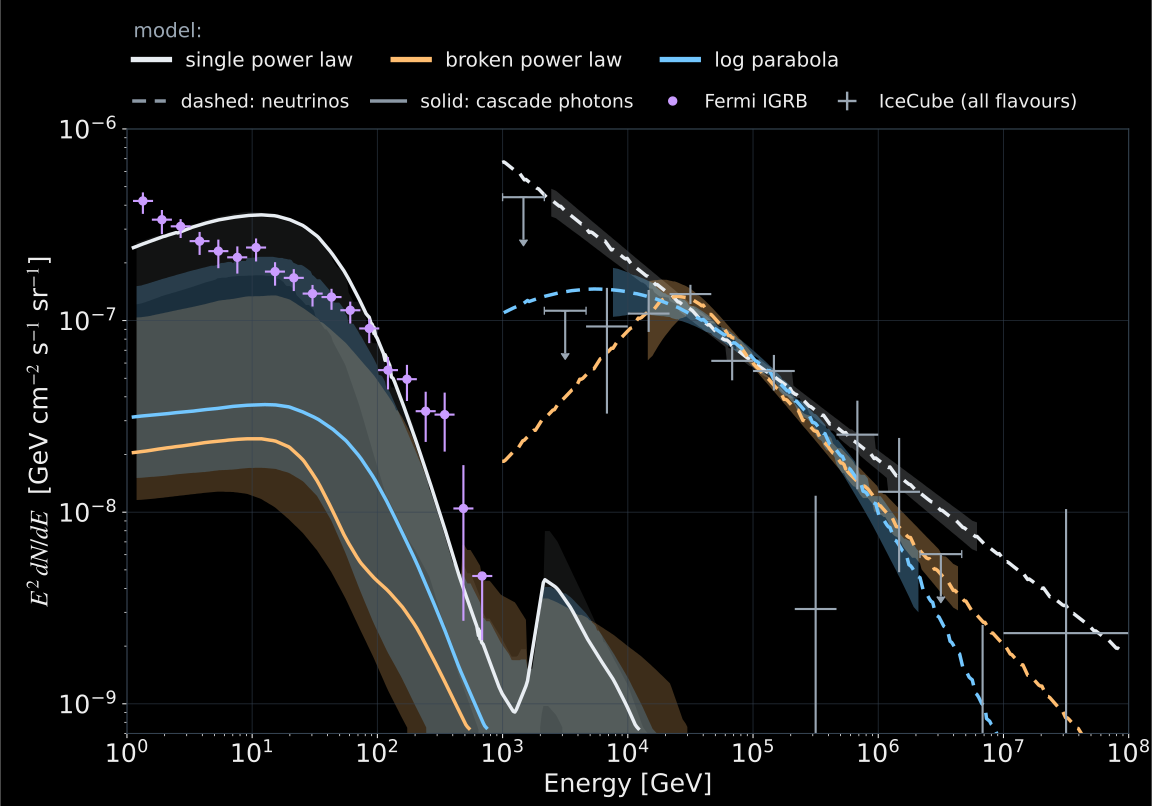
Right: measured neutrinos and fitted spectra.
Left: accompanying cascade photons.
White: unbroken continuation.
Orange: break near \(30\,\mathrm{TeV}\).
The low-energy continuation changes the gamma-ray burden.
Dashed: neutrinos · Solid: calculated photons · \(p\gamma\) benchmark · Digitized from Zathul et al. (2026), Fig. 2, CC BY 4.0
\[ \pi^0\to\gamma\gamma,\qquad \gamma\gamma_{\mathrm{EBL}}\to e^+e^-,\qquad e^\pm\gamma_{\mathrm{bg}}\to e^\pm\gamma \]
Escaping high-energy photons feed a lower-energy electromagnetic cascade.
| Input | Constraint |
|---|---|
| Measured neutrino spectrum | Pion production and its energy dependence |
| Fermi isotropic gamma-ray background | A ceiling on the accompanying extragalactic cascade |
| Internal photon absorption | Redistribution of photon energy before escape |
Other source populations also contribute to the gamma-ray background.
Conversion: Ahlers & Murase (2014) · absorption computed with the EBL of Domínguez et al. (2011) and the CMB · cascade shape schematic, energy conserved · Murase, Ahlers & Lacki (2013), Murase, Guetta & Ahlers (2016)
NGC 1068 and X-ray-bright AGN
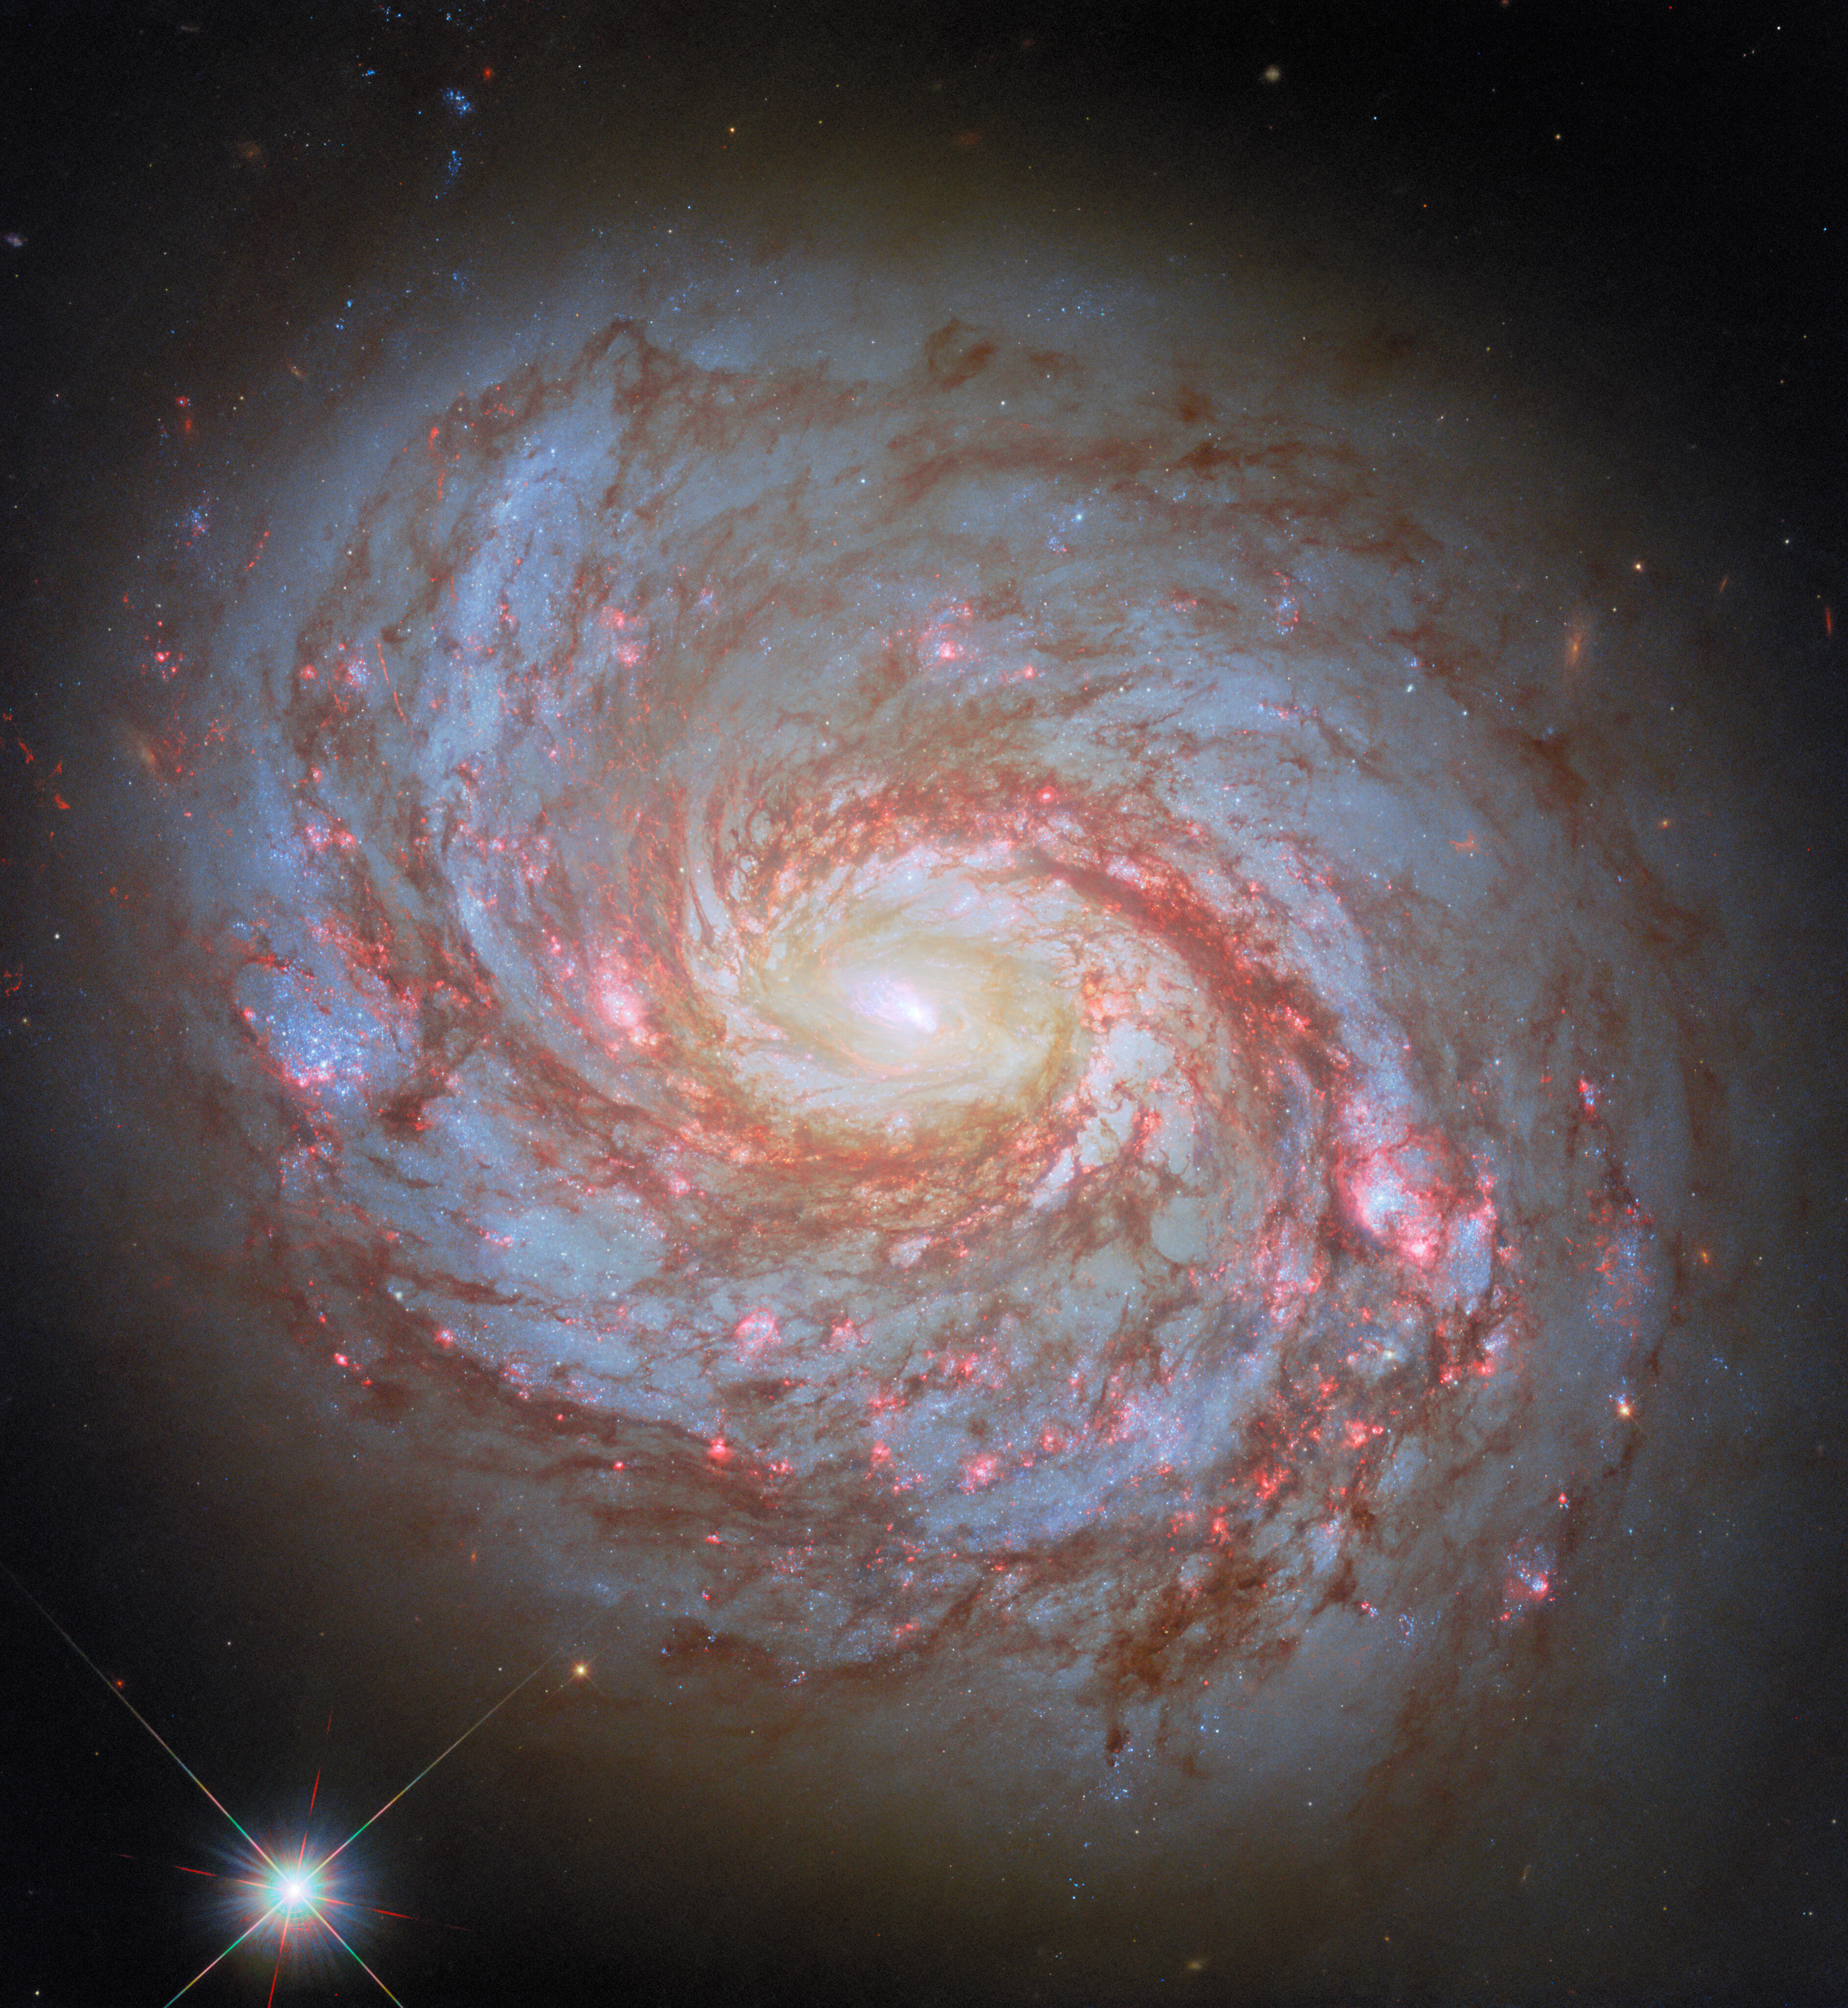
ESA/Hubble & NASA, L. C. Ho, D. Thilker
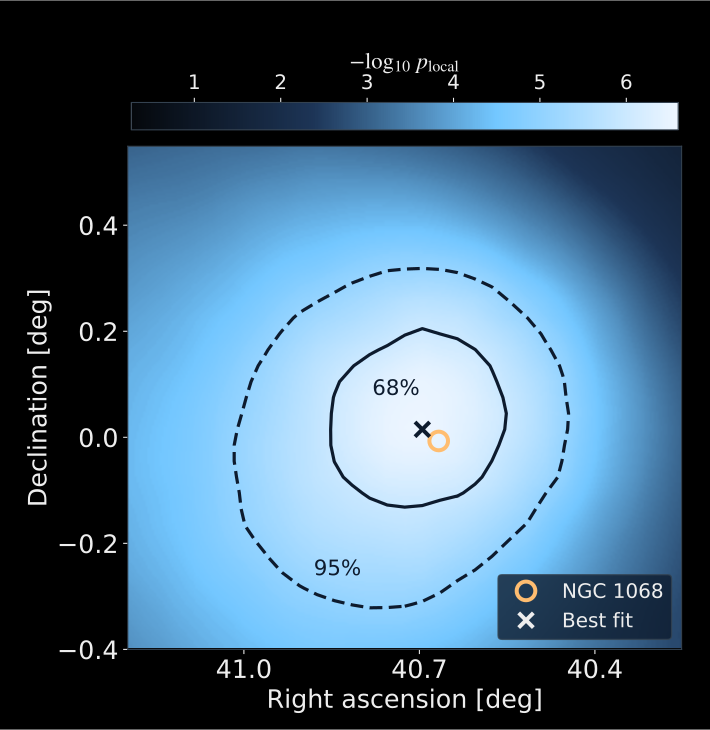
13.1 years
\[4.0\sigma\]
After catalogue trials.
Seyfert 2
A dust-obscured active nucleus.
Hubble (2025) · IceCube Collaboration · Redrawn from 2026 analysis, Fig. 2
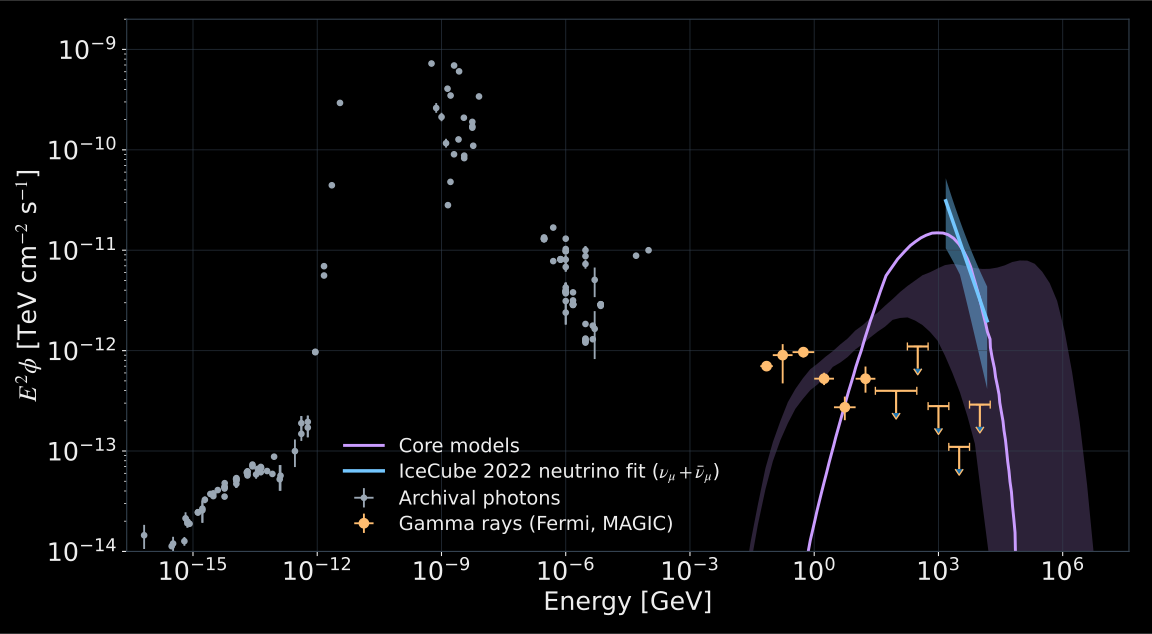
Blue: 2022 neutrino fit.
Orange: gamma-ray data and limits.
Violet: core models.
The photon spectrum constrains where pion production can occur.
Historical comparison · \(\nu_\mu+\bar\nu_\mu\), \(95\%\) fit band · Redrawn from IceCube, Science (2022), Fig. 4
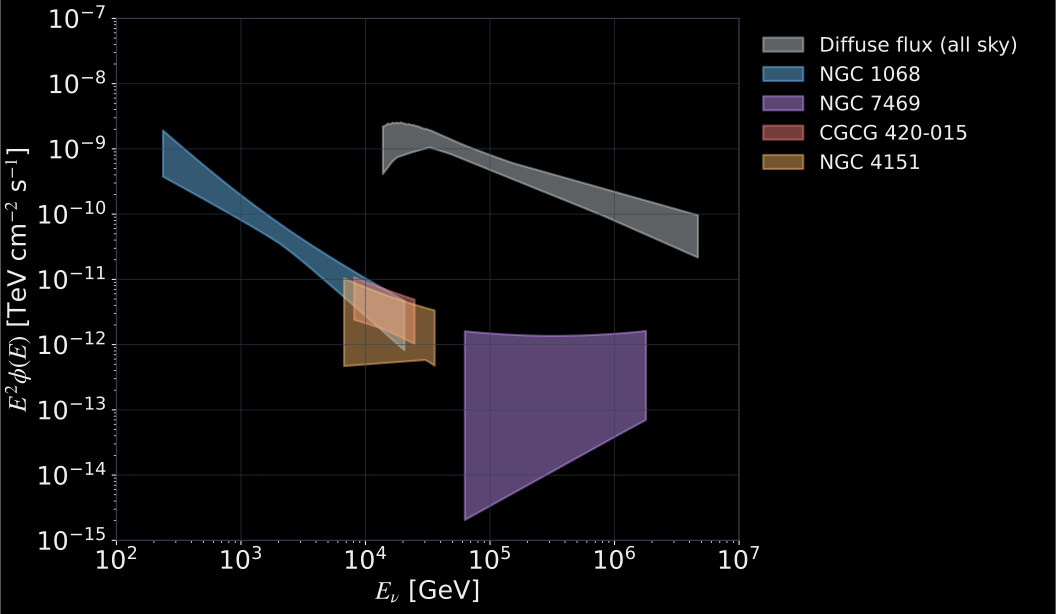
All flavours · NGC 1068: \(\Phi_\nu(E)\propto E^{-\gamma}\), \(\gamma=3.4\pm0.2\) · IceCube Collaboration · Redrawn from the vector artwork
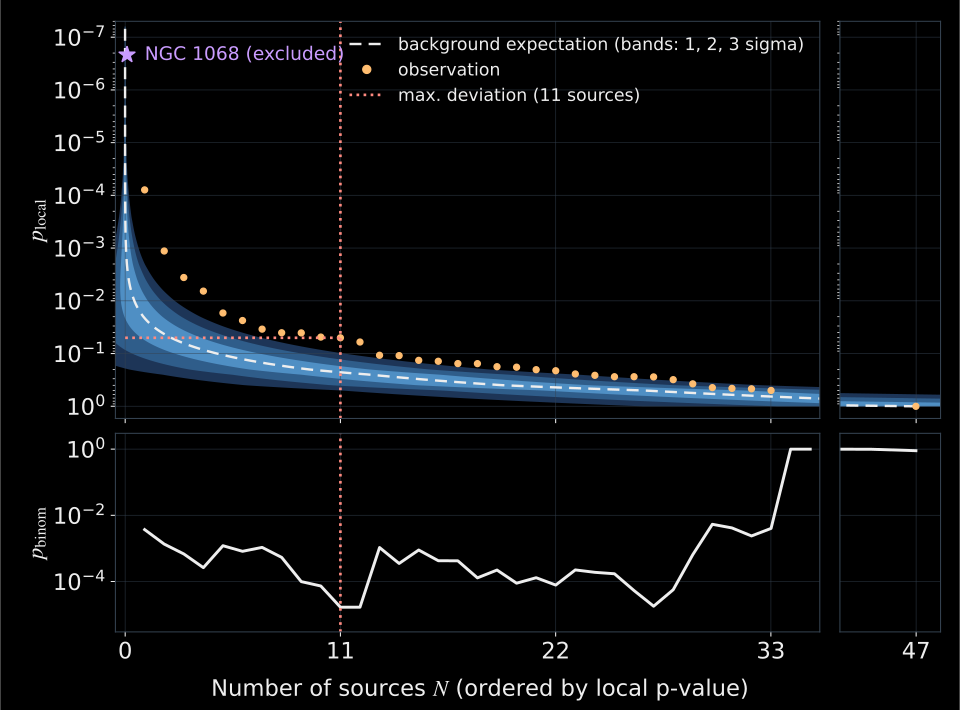
47 X-ray-bright AGN
NGC 1068 excluded.
11-source ensemble
\[3.3\sigma\]
After population trials.
Population evidence, not 11 individually established sources · IceCube Collaboration · Redrawn from the vector artwork
Blazars: TXS 0506+056 and radio-bright jets
22 September 2017
IceCube-170922A
Most probable energy
\[E_\nu\sim290\,\mathrm{TeV}\]
Fermi-LAT + MAGIC
A flaring blazar in the neutrino direction.
\(\sim3\sigma\) association
IceCube Collaboration · Multimessenger observations, Science (2018)
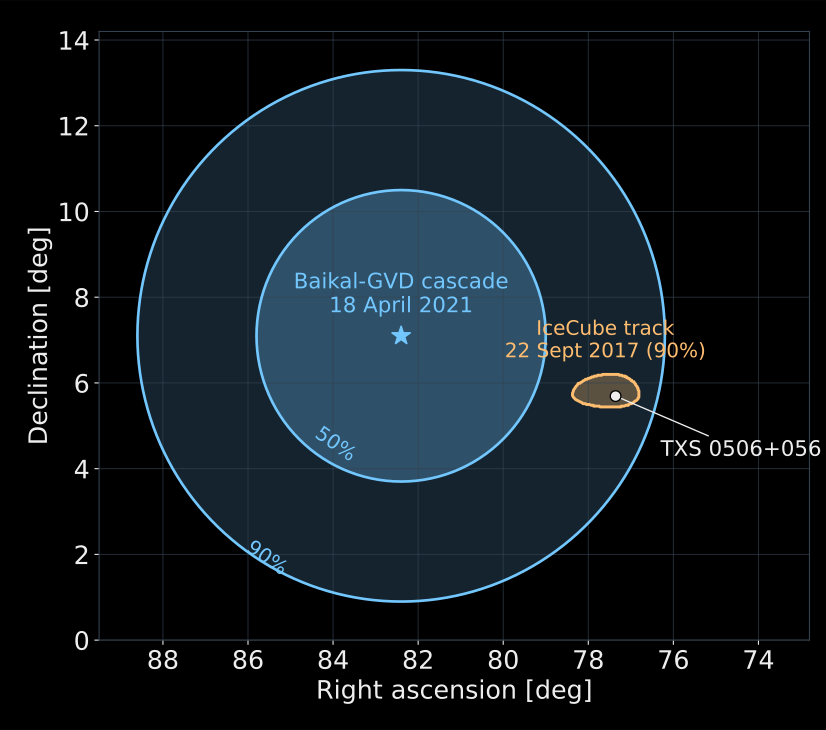
18 April 2021
A cascade in Lake Baikal, from below the horizon.
\[E_{\rm sh}\simeq224\,\mathrm{TeV}\]
The blazar lies inside its error circle.
A candidate, not a proof.
Baikal-GVD Collaboration · Redrawn from TXS 0506+056 candidate, ICRC 2023, Fig. 3; IceCube contour digitized
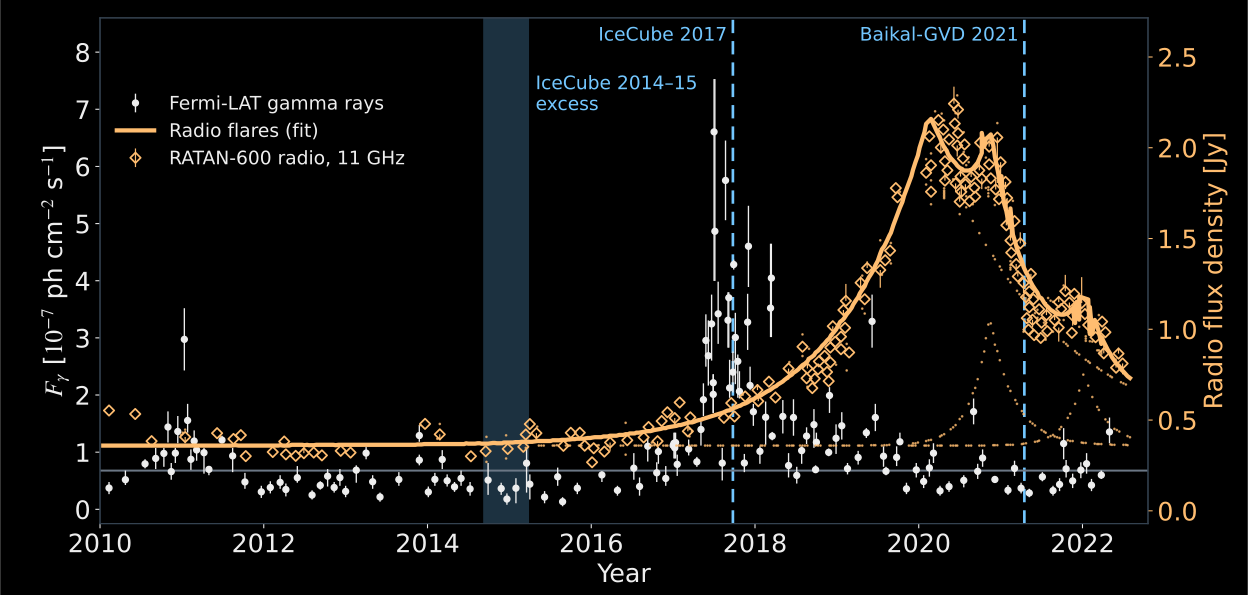
Both neutrinos arrived as a strong radio flare began.
White: Fermi-LAT gamma rays · Orange: RATAN-600, 11 GHz, and fitted flares · Dashed: neutrino arrivals · Digitized from Baikal-GVD, ICRC 2023, Fig. 4
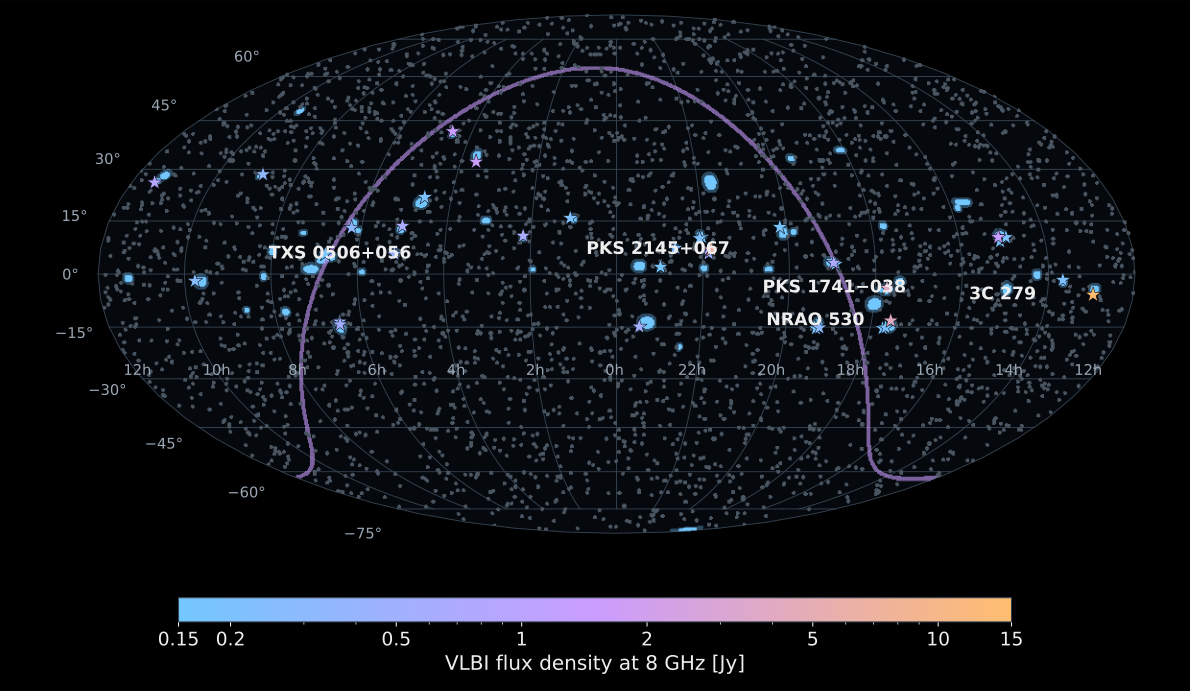
IceCube events above 200 TeV
Blazars with bright parsec-scale radio cores sit inside their error regions more often than chance allows.
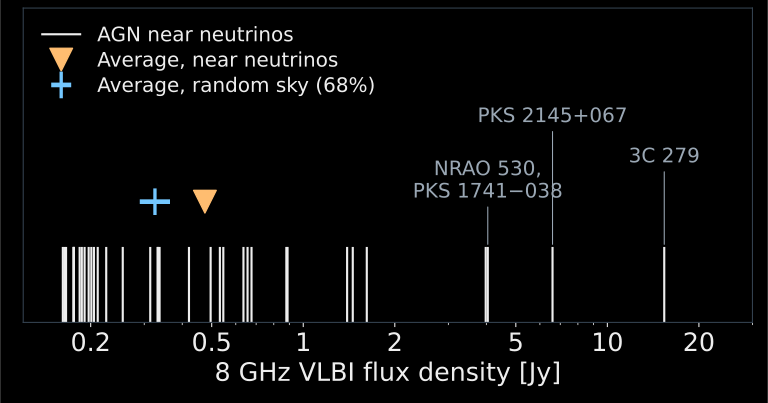
Post-trial \(p=2\times10^{-3}\)
Still debated: an IceCube search with its alert events finds no significant correlation.
A. V. Plavin, Y. Y. Kovalev, Y. A. Kovalev, S. V. Troitsky · Redrawn from ApJ 894, 101 (2020), Figs. 1 and 3 · ICRC 2021 · IceCube (2023)
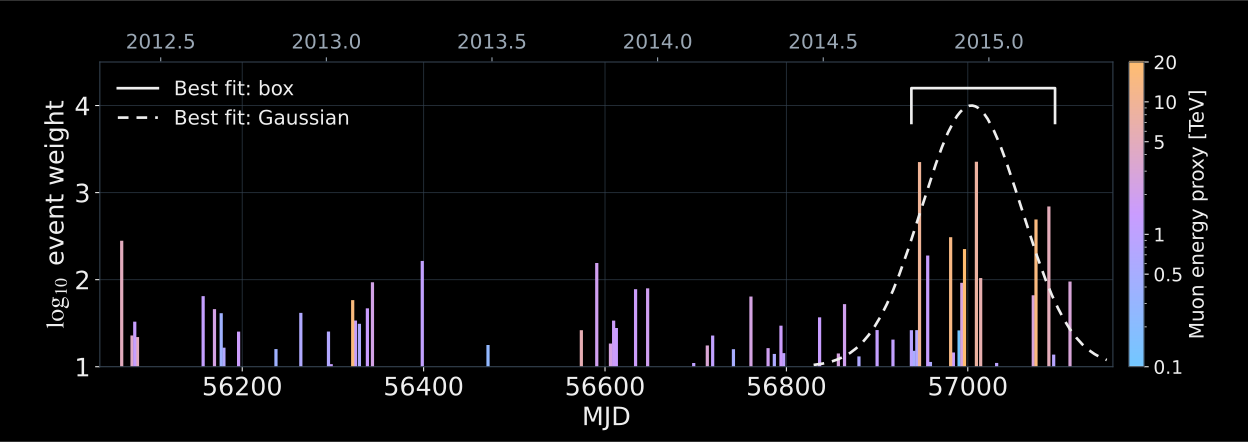
\(13\pm5\) excess events · \(3.5\sigma\)
No matching strong gamma-ray flare.
Historical 2018 analysis · Redrawn from IceCube Collaboration, Science (2018), Fig. 2
Original processing
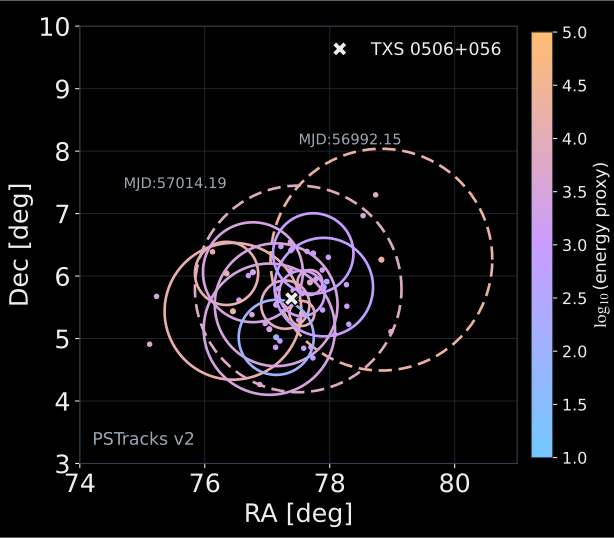
Updated processing
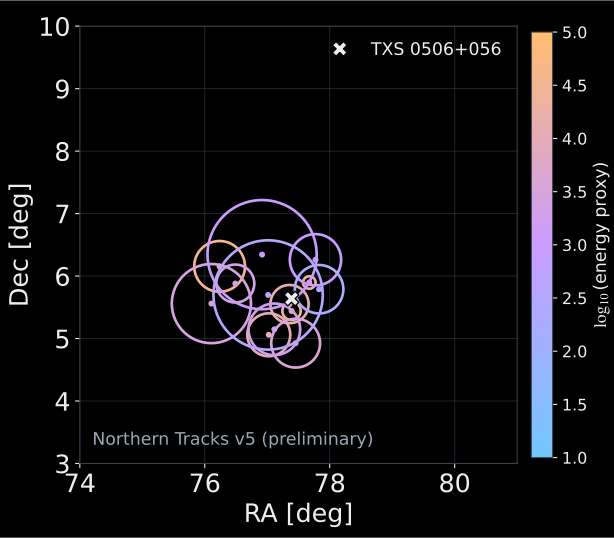
Two cascade-like events removed; a smaller fitted excess.
Same flare, revised event sample · IceCube, ICRC 2023 · Both panels redrawn from the vector artwork
KM3-230213A: an ultra-high-energy event
13 February 2023
ARCA · 21 detection units
Parent neutrino
\[E_\nu\sim220\,\mathrm{PeV}\]
- Nearly horizontal.
- No identified counterpart.
KM3NeT Collaboration · Nature (2025)
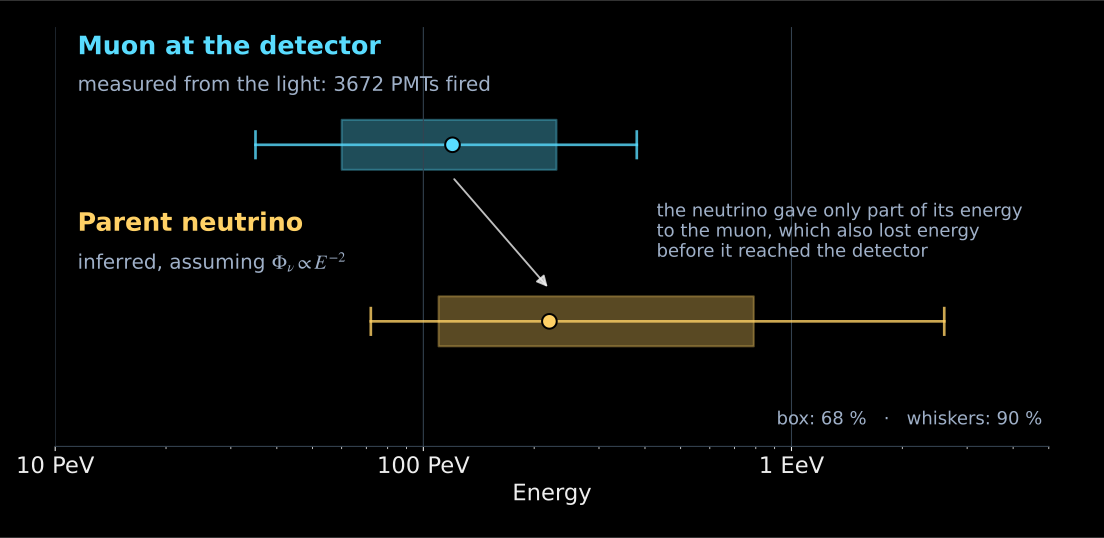
Muon at the detector
\[E_\mu=120^{+110}_{-60}\,\mathrm{PeV}\]
\(68\%\) confidence interval
Parent neutrino
Median: \(220\,\mathrm{PeV}\)
Central \(68\%\): \(110–790\,\mathrm{PeV}\)
Assuming \(\Phi_\nu(E)\propto E^{-2}\).
Drawn from the numbers in the text of KM3NeT, Nature (2025) · Their Fig. 2 (CC BY-NC-ND) is kept unmodified for questions
Neutrino observatories
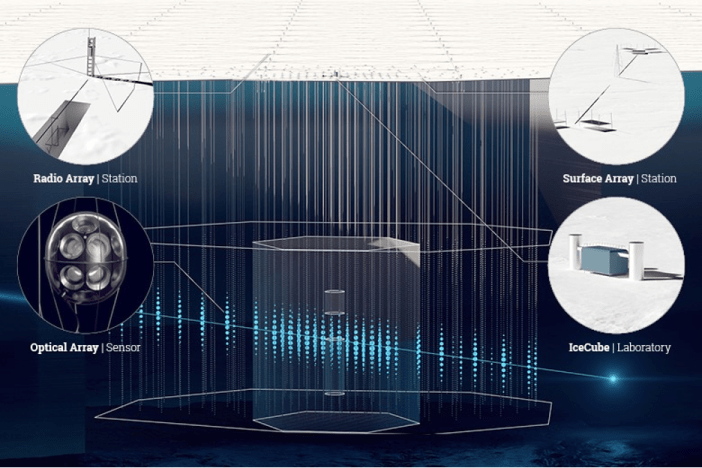
South Pole, Antarctic ice
IceCube: \(1\,\mathrm{km}^3\), operating.
Upgrade: 5 new strings, installed in 2026.
Gen2: \(8\,\mathrm{km}^3\) optical array, proposed.
Measurement: more high-energy events; improved calibration and a radio extension.
Mediterranean Sea
ARCA: \(\sim1\,\mathrm{km}^3\) for neutrino astronomy.
ORCA: \(\sim7\,\mathrm{Mt}\) for neutrino oscillations.
Full design: 230 / 115 strings.
Construction and data taking.
Measurement: source searches with ARCA; oscillations with ORCA.
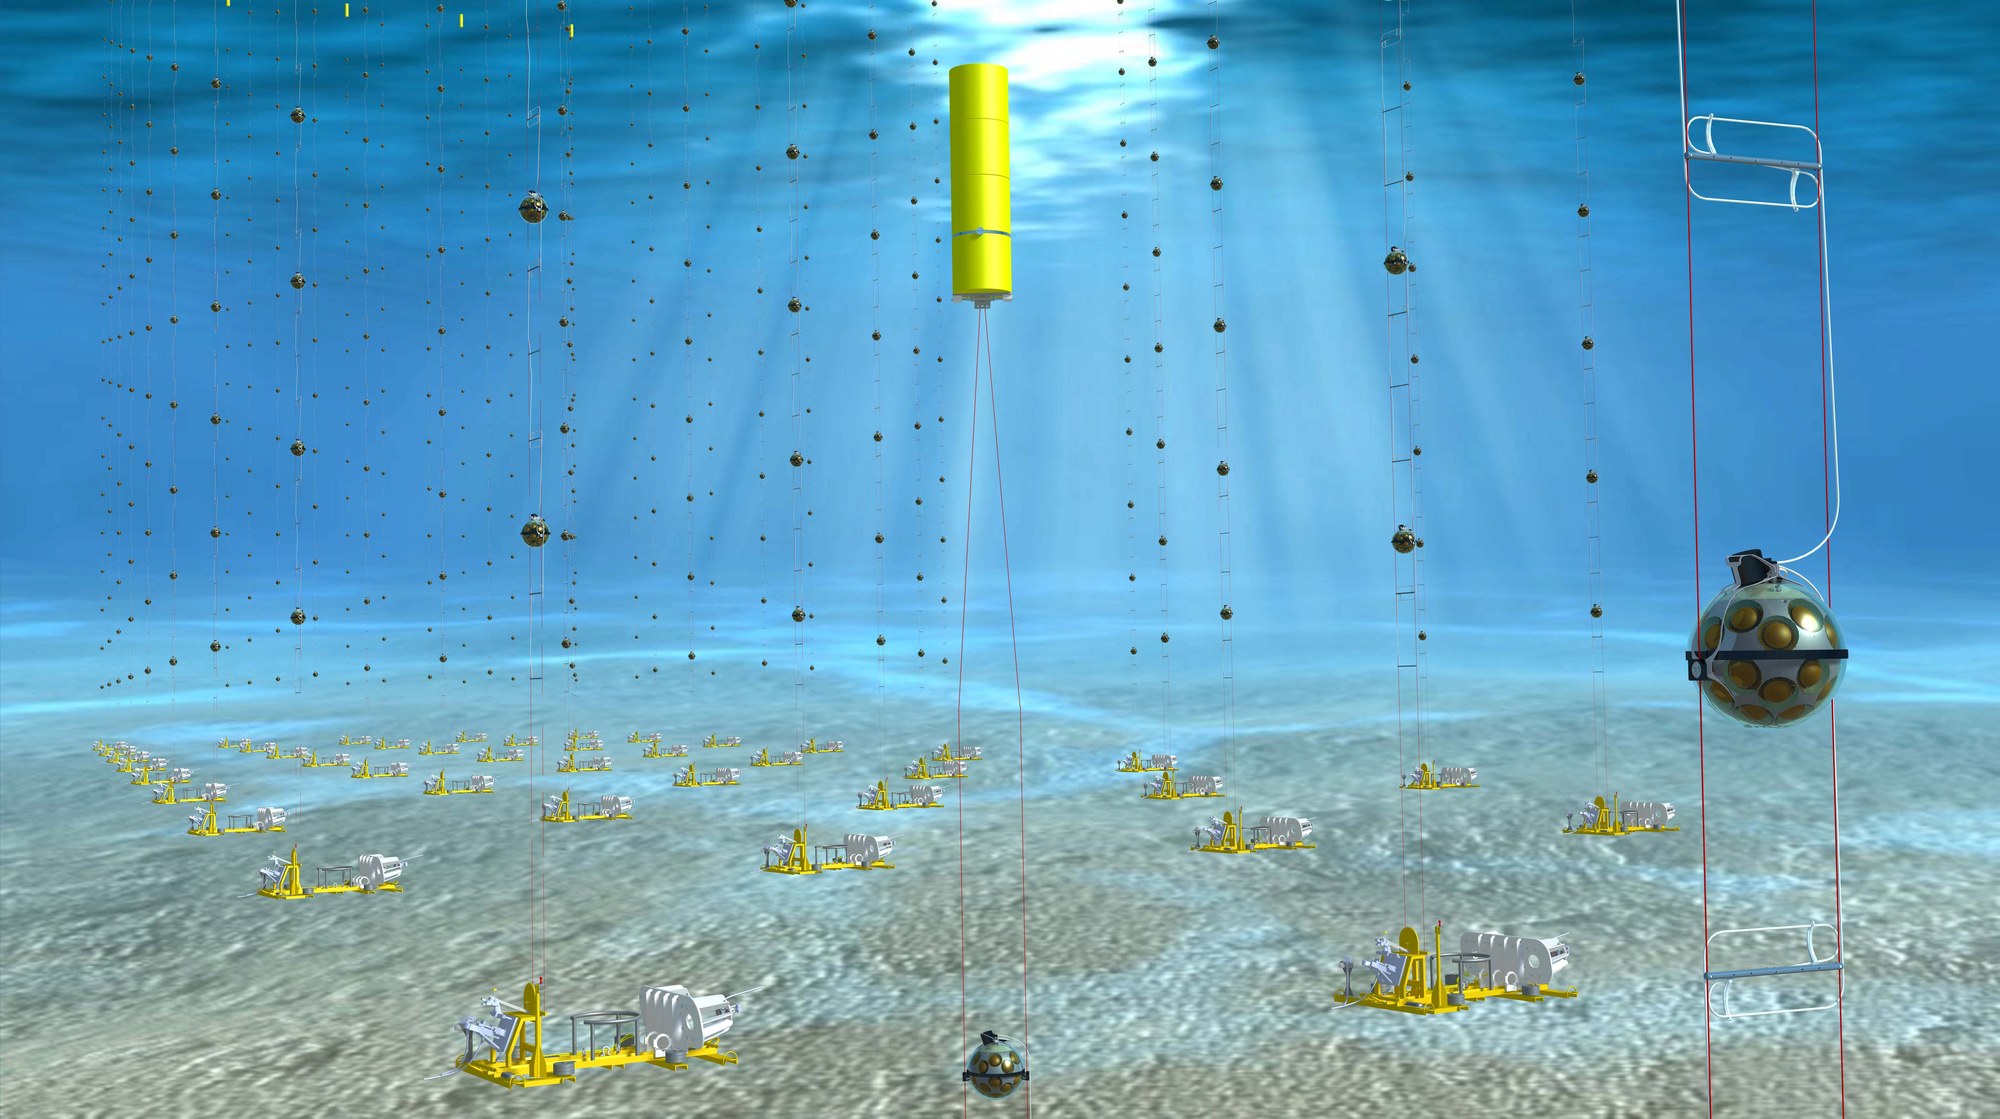
Artist’s impression · Edward Berbee/Nikhef · KM3NeT
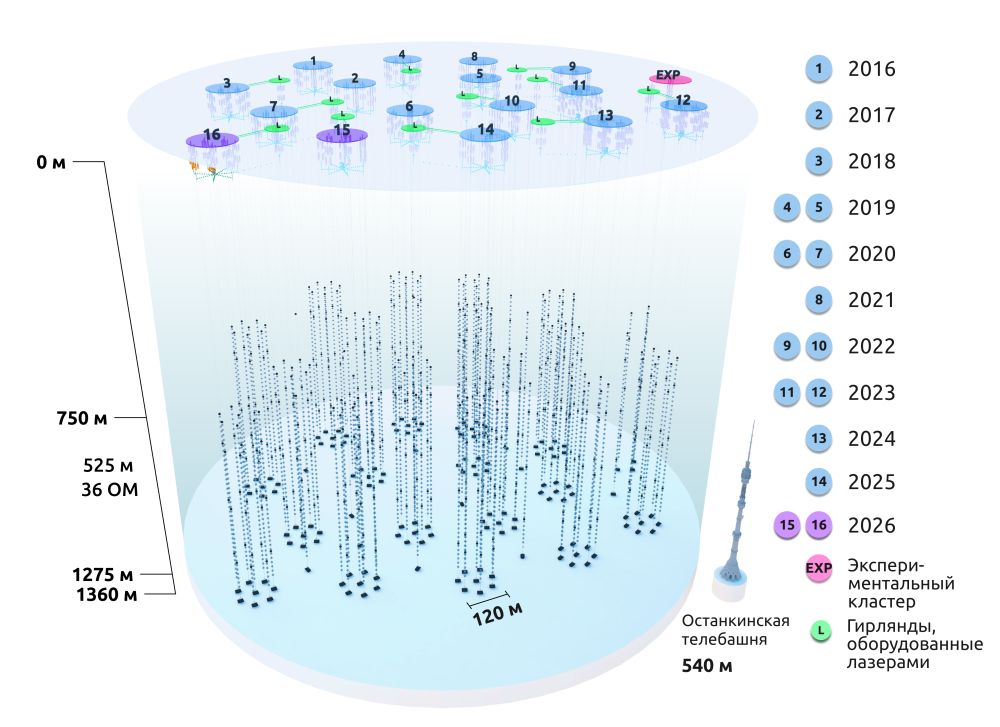
Lake Baikal, fresh water
2026: 16 clusters, operating.
Reported effective volume: \(0.8\,\mathrm{km}^3\).
Modular growth through winter deployment.
Measurement: independent diffuse spectra and northern-site source searches.
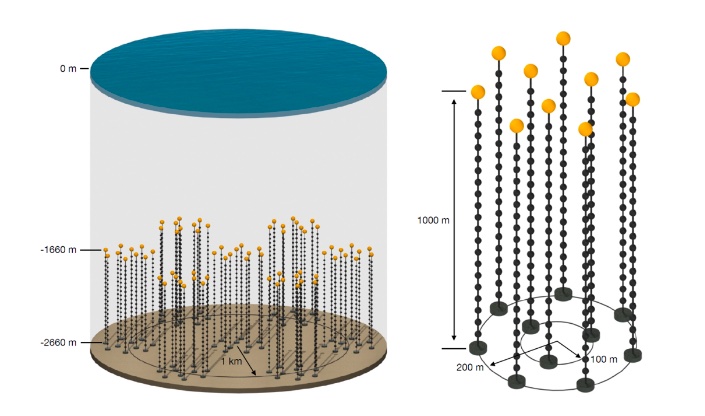
Pacific Ocean, British Columbia
Full design: \(\sim1\,\mathrm{km}^3\), 70 strings.
- Ocean Networks Canada’s NEPTUNE infrastructure.
- Prototype and deployment engineering.
Measurement: neutrino astronomy from another northern ocean site.
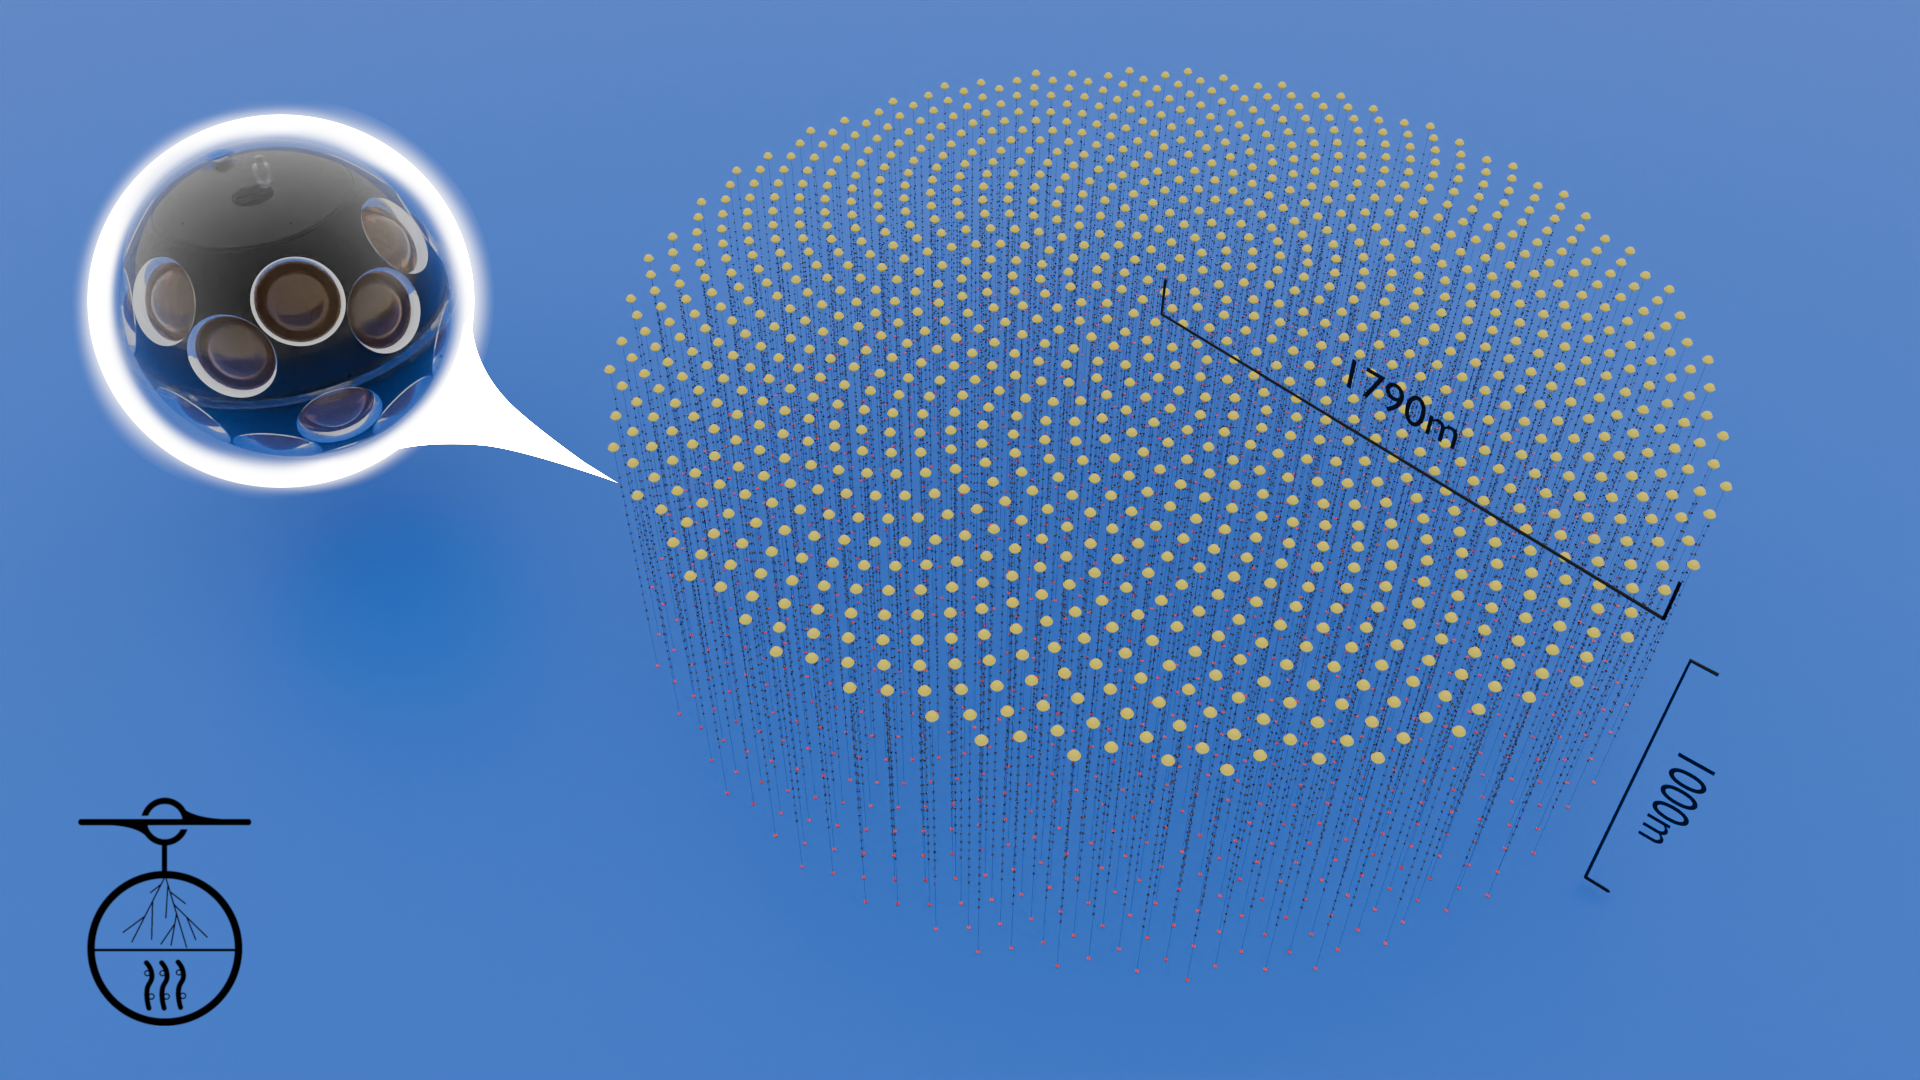
South China Sea
Design: \(7.5\,\mathrm{km}^3\), 1,211 strings.
Sensors: hybrid PMT + SiPM modules.
R&D and pathfinder programme.
Design goal: photon timing and directional information from hybrid sensors.
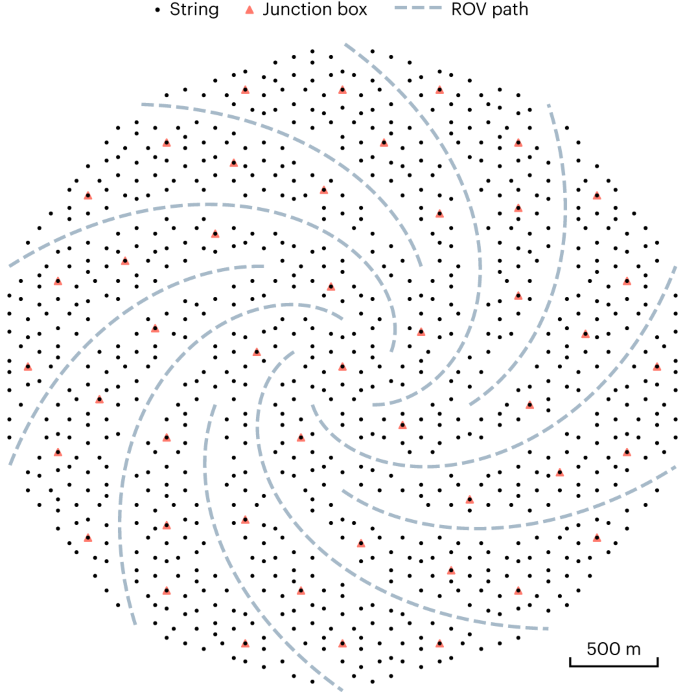
China + Russia
Design: \(\sim30\,\mathrm{km}^3\).
Sensors: 20-inch PMTs.
The Baikal option, B-HUNT, is the next slide.
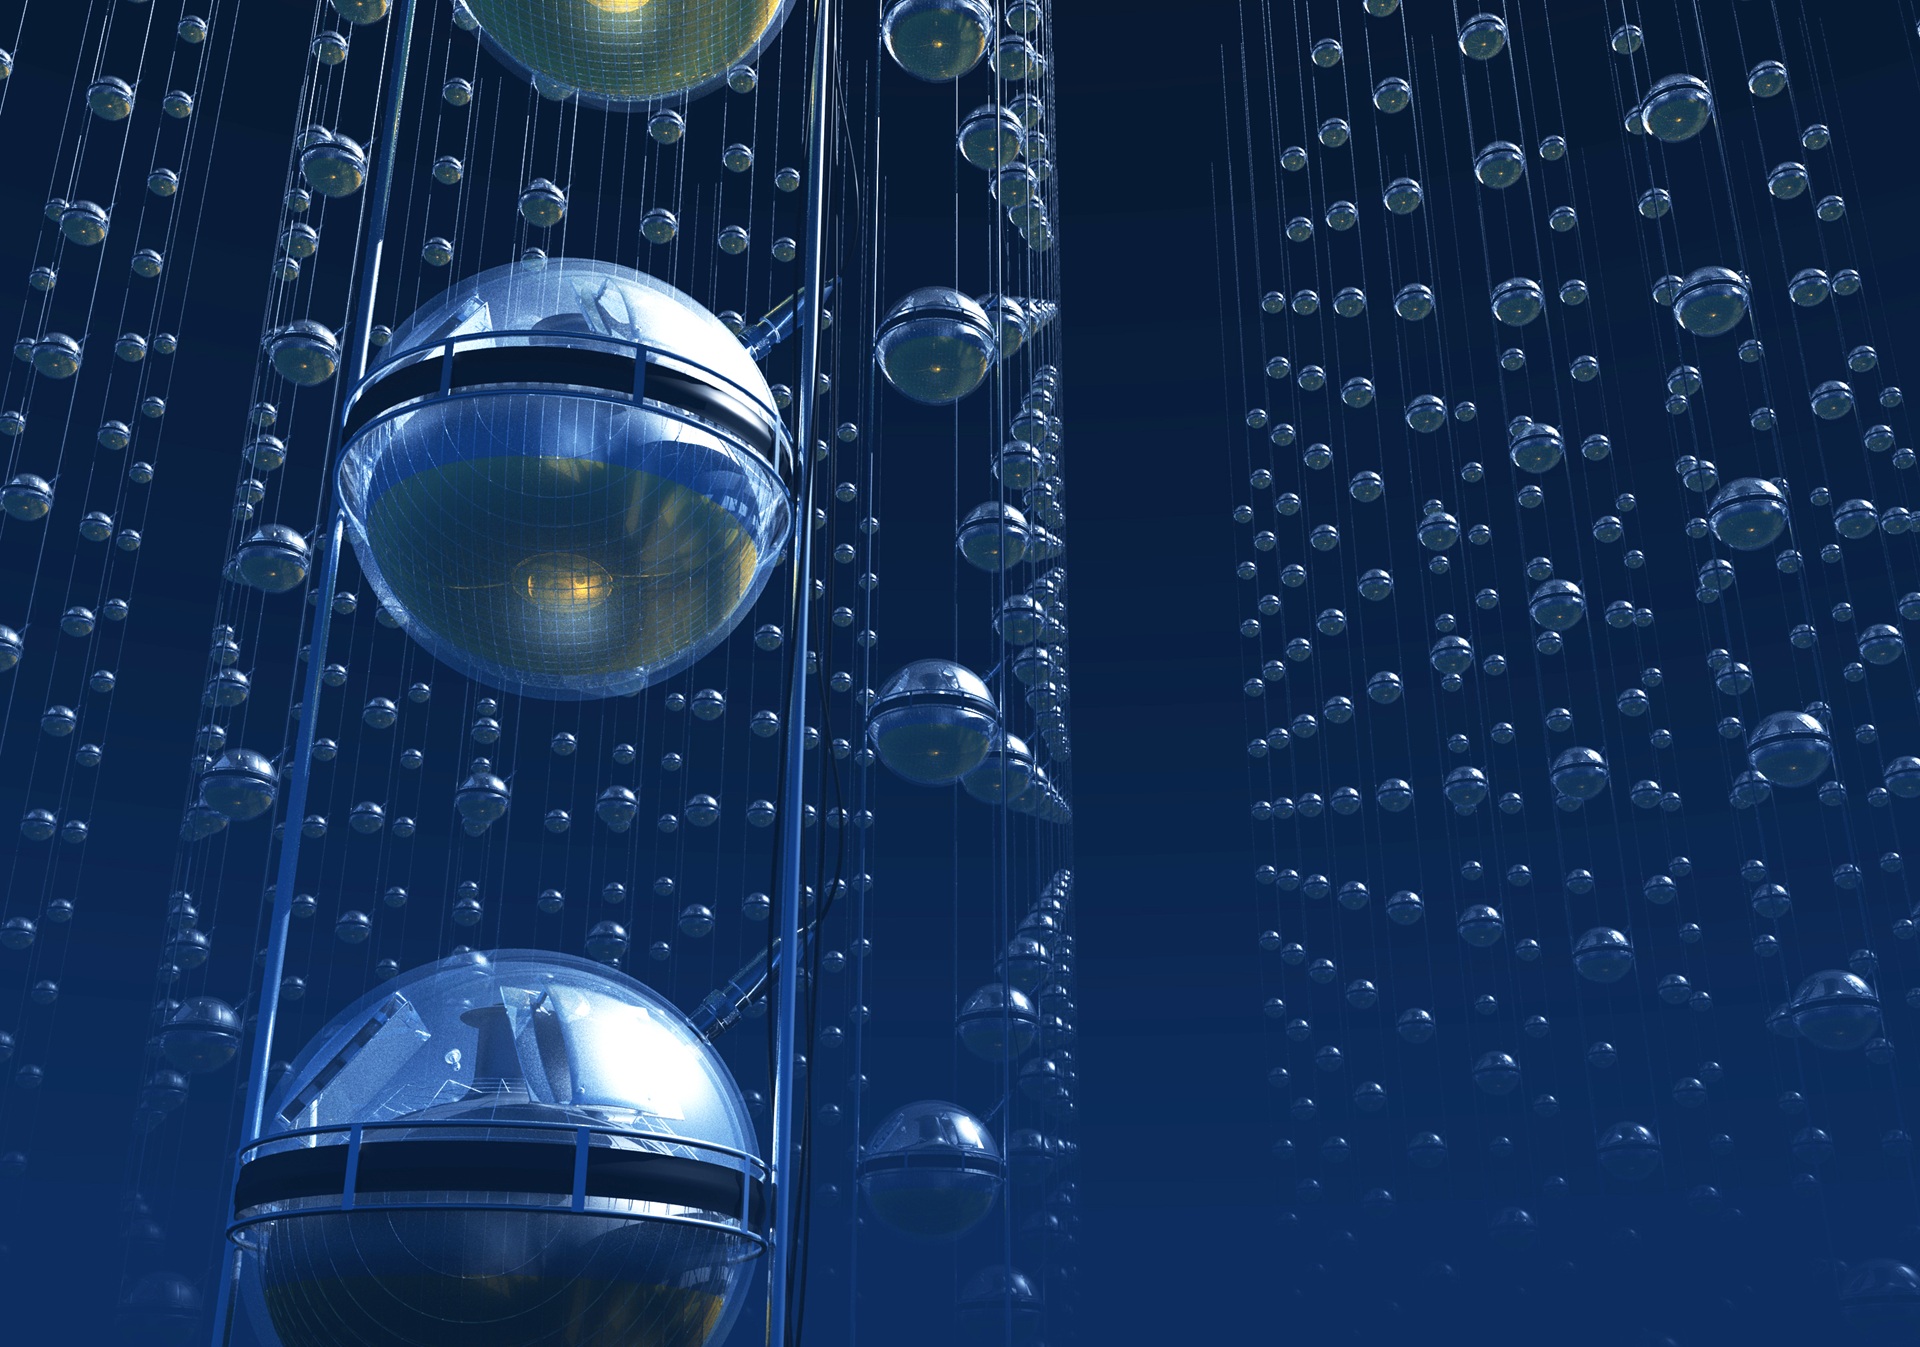
South China Sea
Design: \(10\,\mathrm{km}^3\), 1,200 strings.
Sensors: multi-PMT optical modules.
Proposal and hardware R&D.
Design goal: high-energy source searches with a large multi-PMT array.
Baikal-GVD → B-HUNT
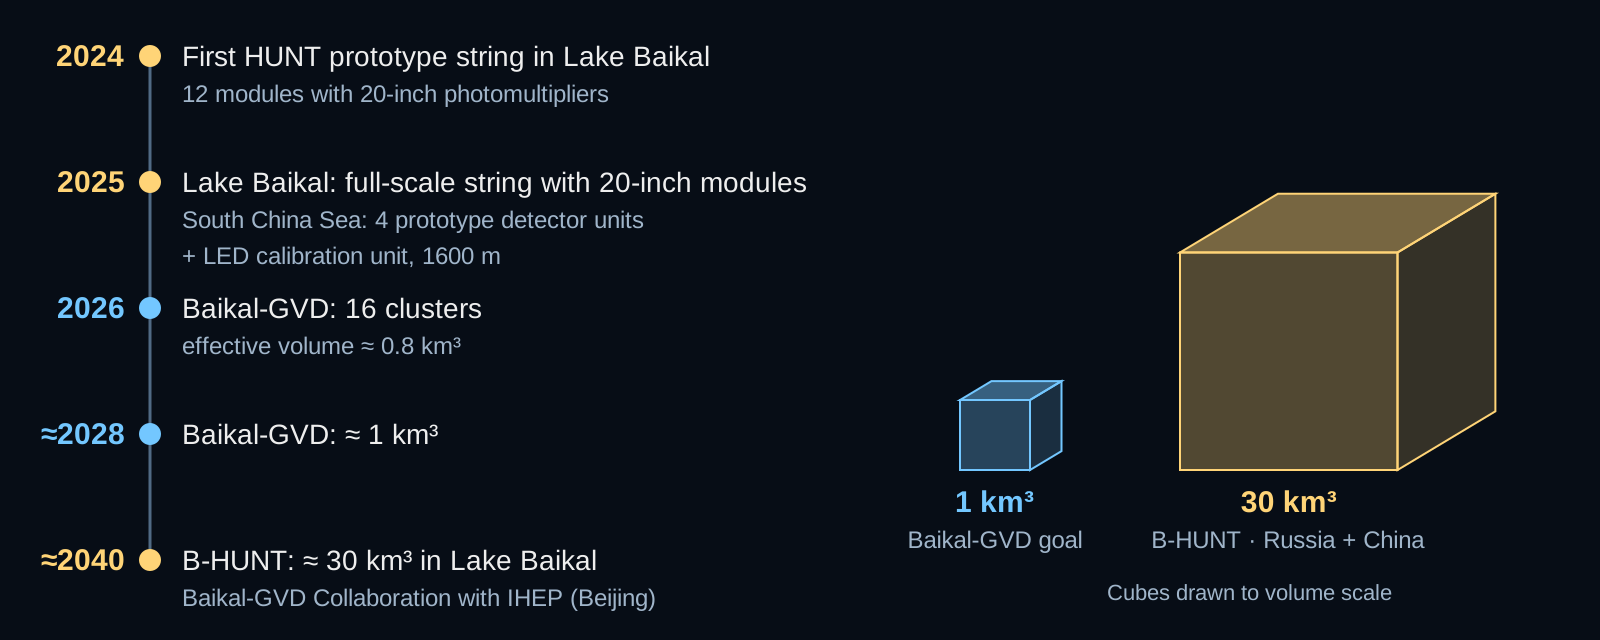
Russia + China · Baikal-GVD Collaboration with IHEP (Beijing) · JINR (2026) · IHEP
The ice is a platform: strings are deployed from the frozen lake every winter.
Water: light scatters less than in ice, so cascade directions are sharper.
Northern site: the Galactic Centre is below the horizon \(75\%\) of the day.
A gamma-ray partner: LHAASO watches the same northern sky.
Alerts and follow-up: work in progress.
What we want to discover
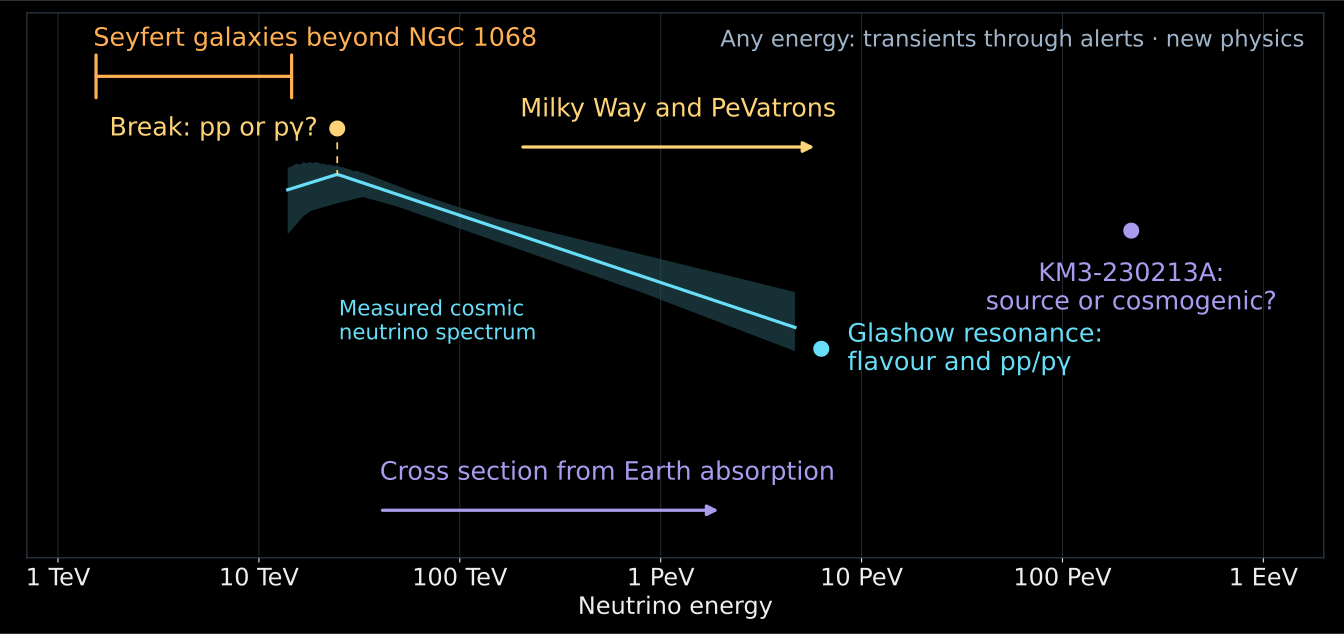
Questions on the energy axis · Spectrum: IceCube (2026) · Glashow: IceCube (2021) · KM3-230213A: KM3NeT (2025)
What we lack
| What is missing | Why it matters |
|---|---|
| Northern exposure beyond \(10\,\mathrm{km}^3\) | Faint sources and the Galactic Centre seen through the Earth |
| Sharper cascade directions | All flavours point back to sources |
| More events above \(1\,\mathrm{PeV}\) | The spectrum’s end, Glashow events, the 100 PeV puzzle |
| Global alerts, joint analyses, open data | One sky, several telescopes |
| Calibrated optics of water and ice | Energies and directions we can trust |
| Population theory within the gamma-ray budget | Turning many faint hints into sources |
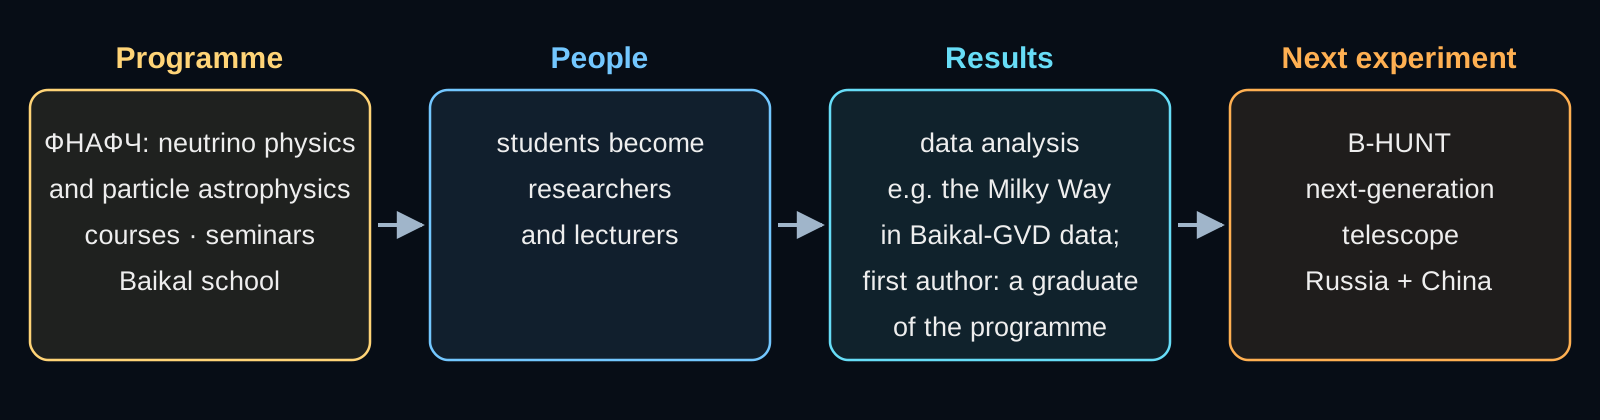
Telescopes are built and understood by people.
ФНАФЧ — Физика нейтрино и астрофизика частиц · Courses on teach-in.ru
Where are the sources?
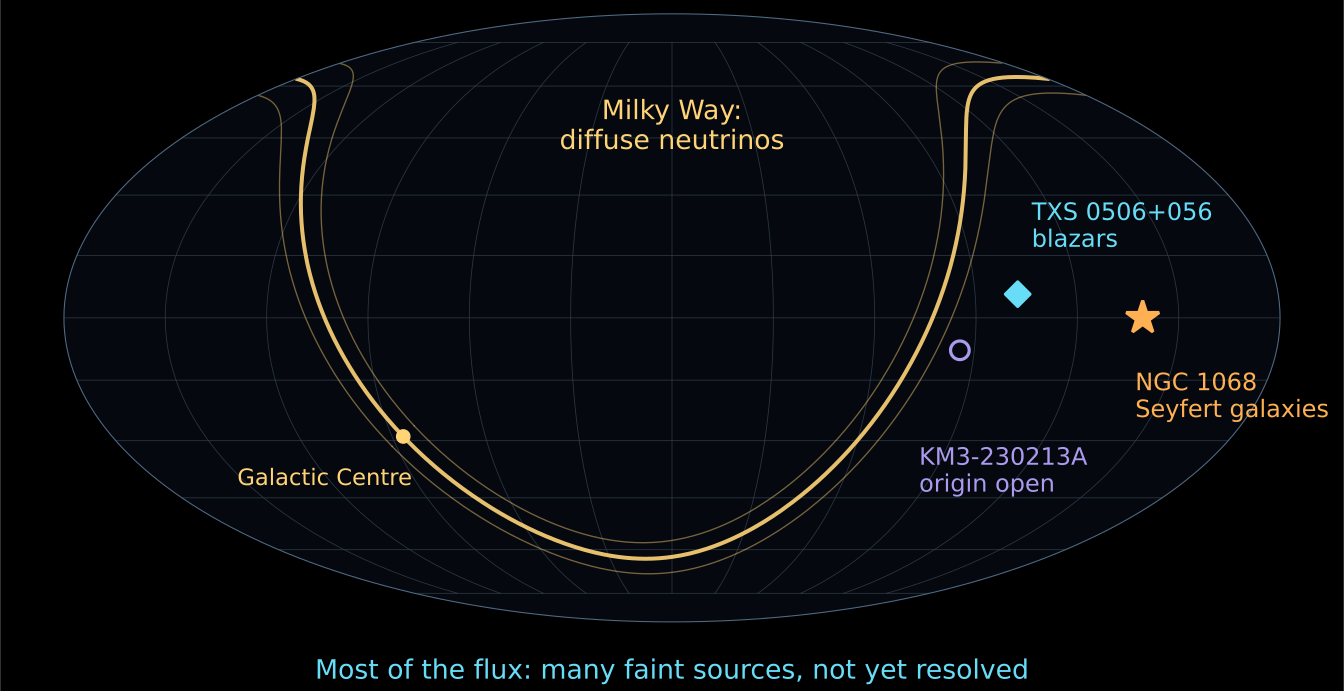
Found: our Galaxy · NGC 1068 and Seyfert galaxies · blazar candidates.
Still open: most of the flux — a crowd of faint sources.
Next: bigger telescopes and networks — B-HUNT, KM3NeT, IceCube-Gen2.
We have found where to look. Next we must resolve the crowd.
Positions: Baikal-GVD source list (2026) · Evidence: result slides of this lecture
Cherenkov light
Gold: charge. Blue circles: wavefronts. White: common front. Cyan arrows: light.
Light gets ahead — \(v<c/n\)
The particle gets ahead — \(v>c/n\)
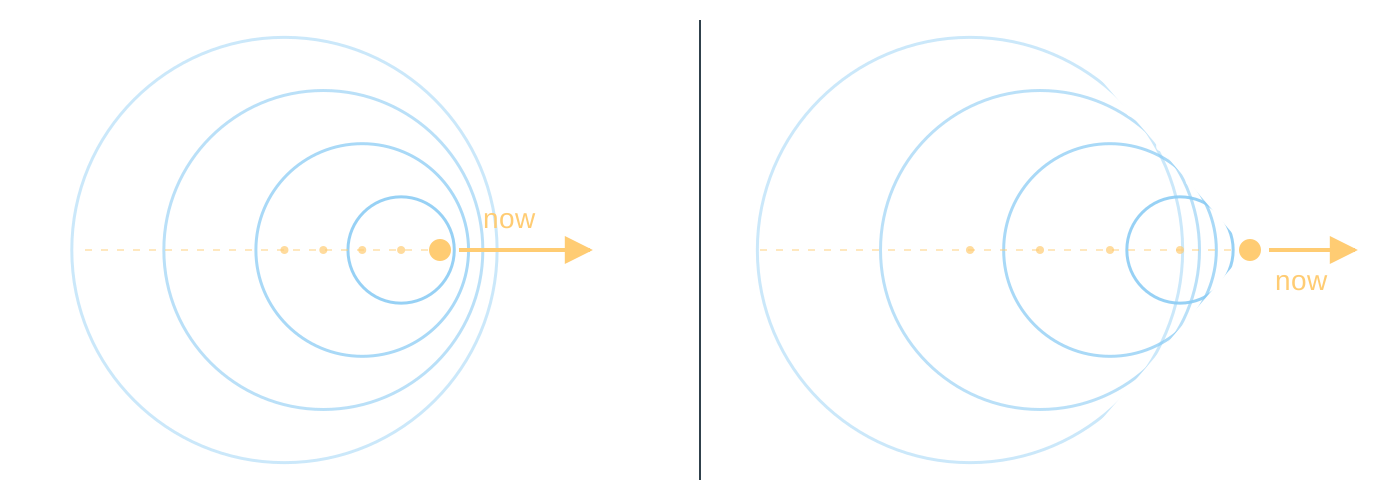
The charge disturbs the medium. A fast charge leaves a common wavefront behind.
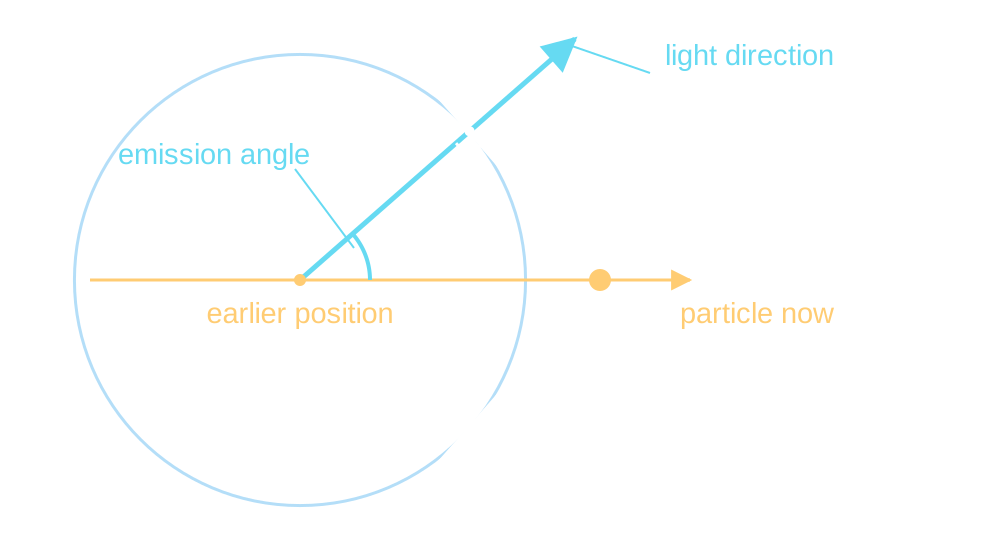
Light goes across the front — not along it.
\[ \cos\theta_C=\frac{c}{nv} \qquad\Longrightarrow\qquad \theta_C\simeq41^\circ\ \text{in water, for }v\simeq c. \]
One photon, a measurable pulse
IceCube
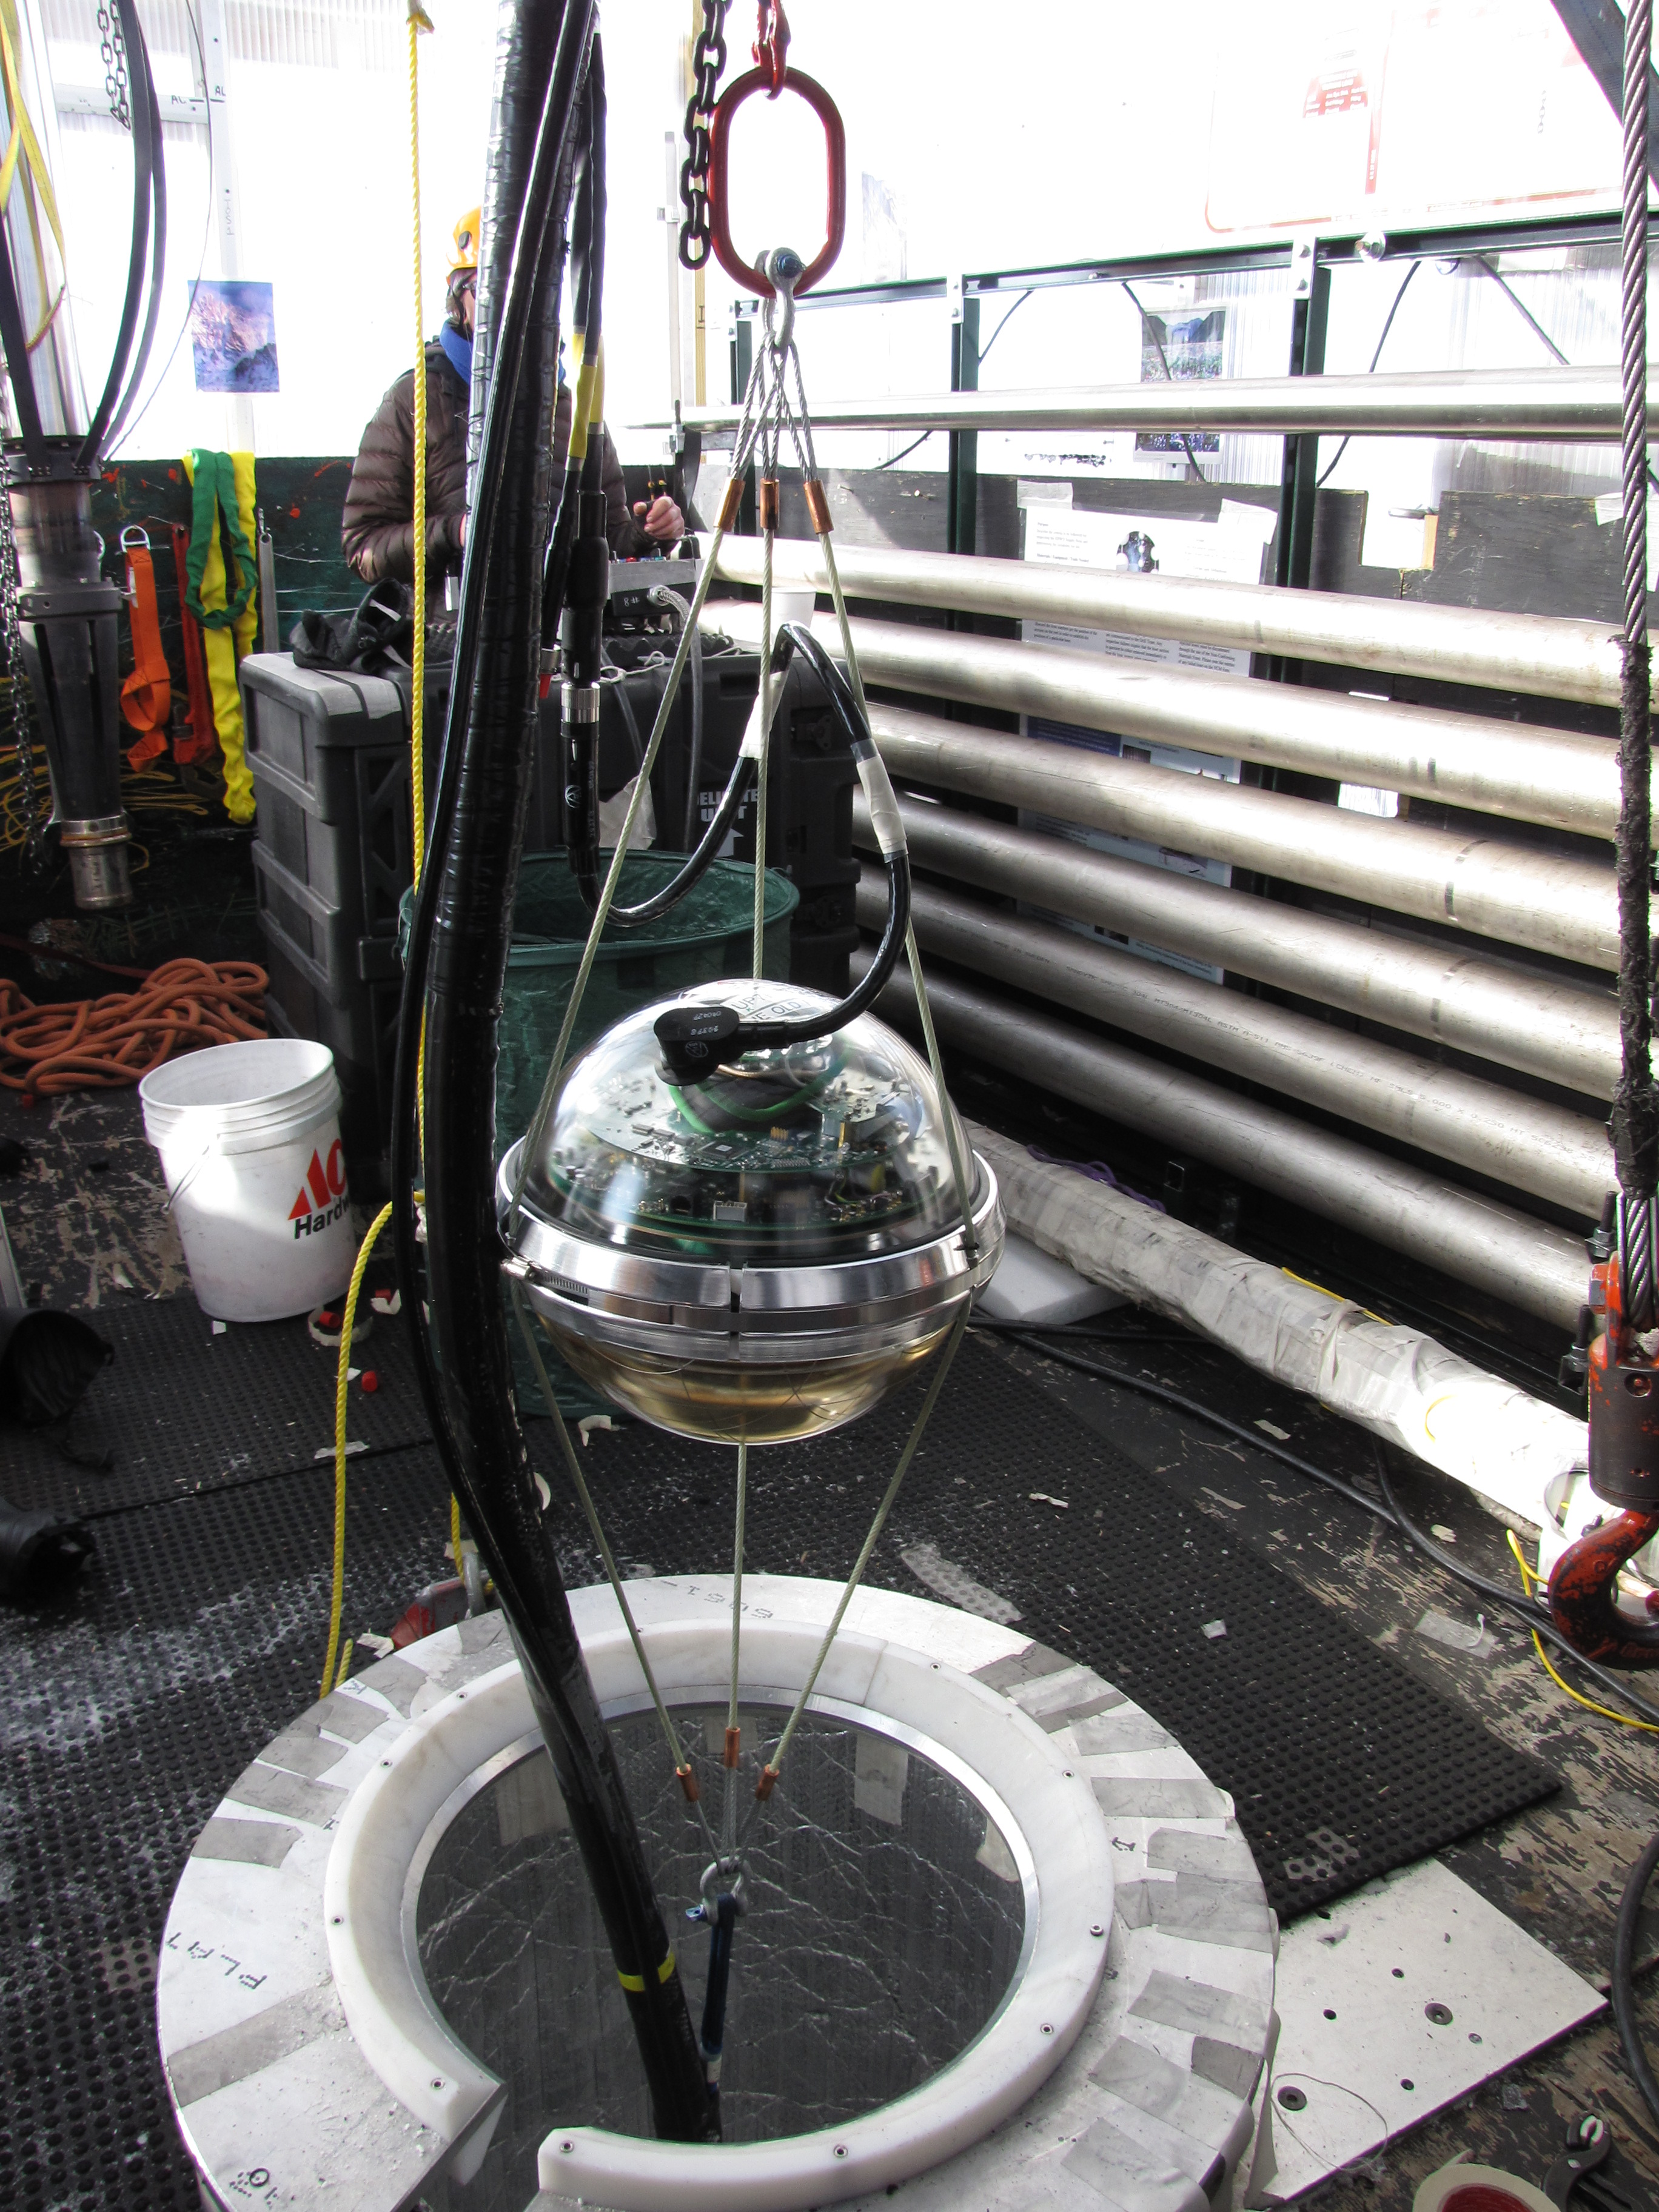
One \(10\,\mathrm{inch}\) PMT.
IceCube/NSF.
KM3NeT
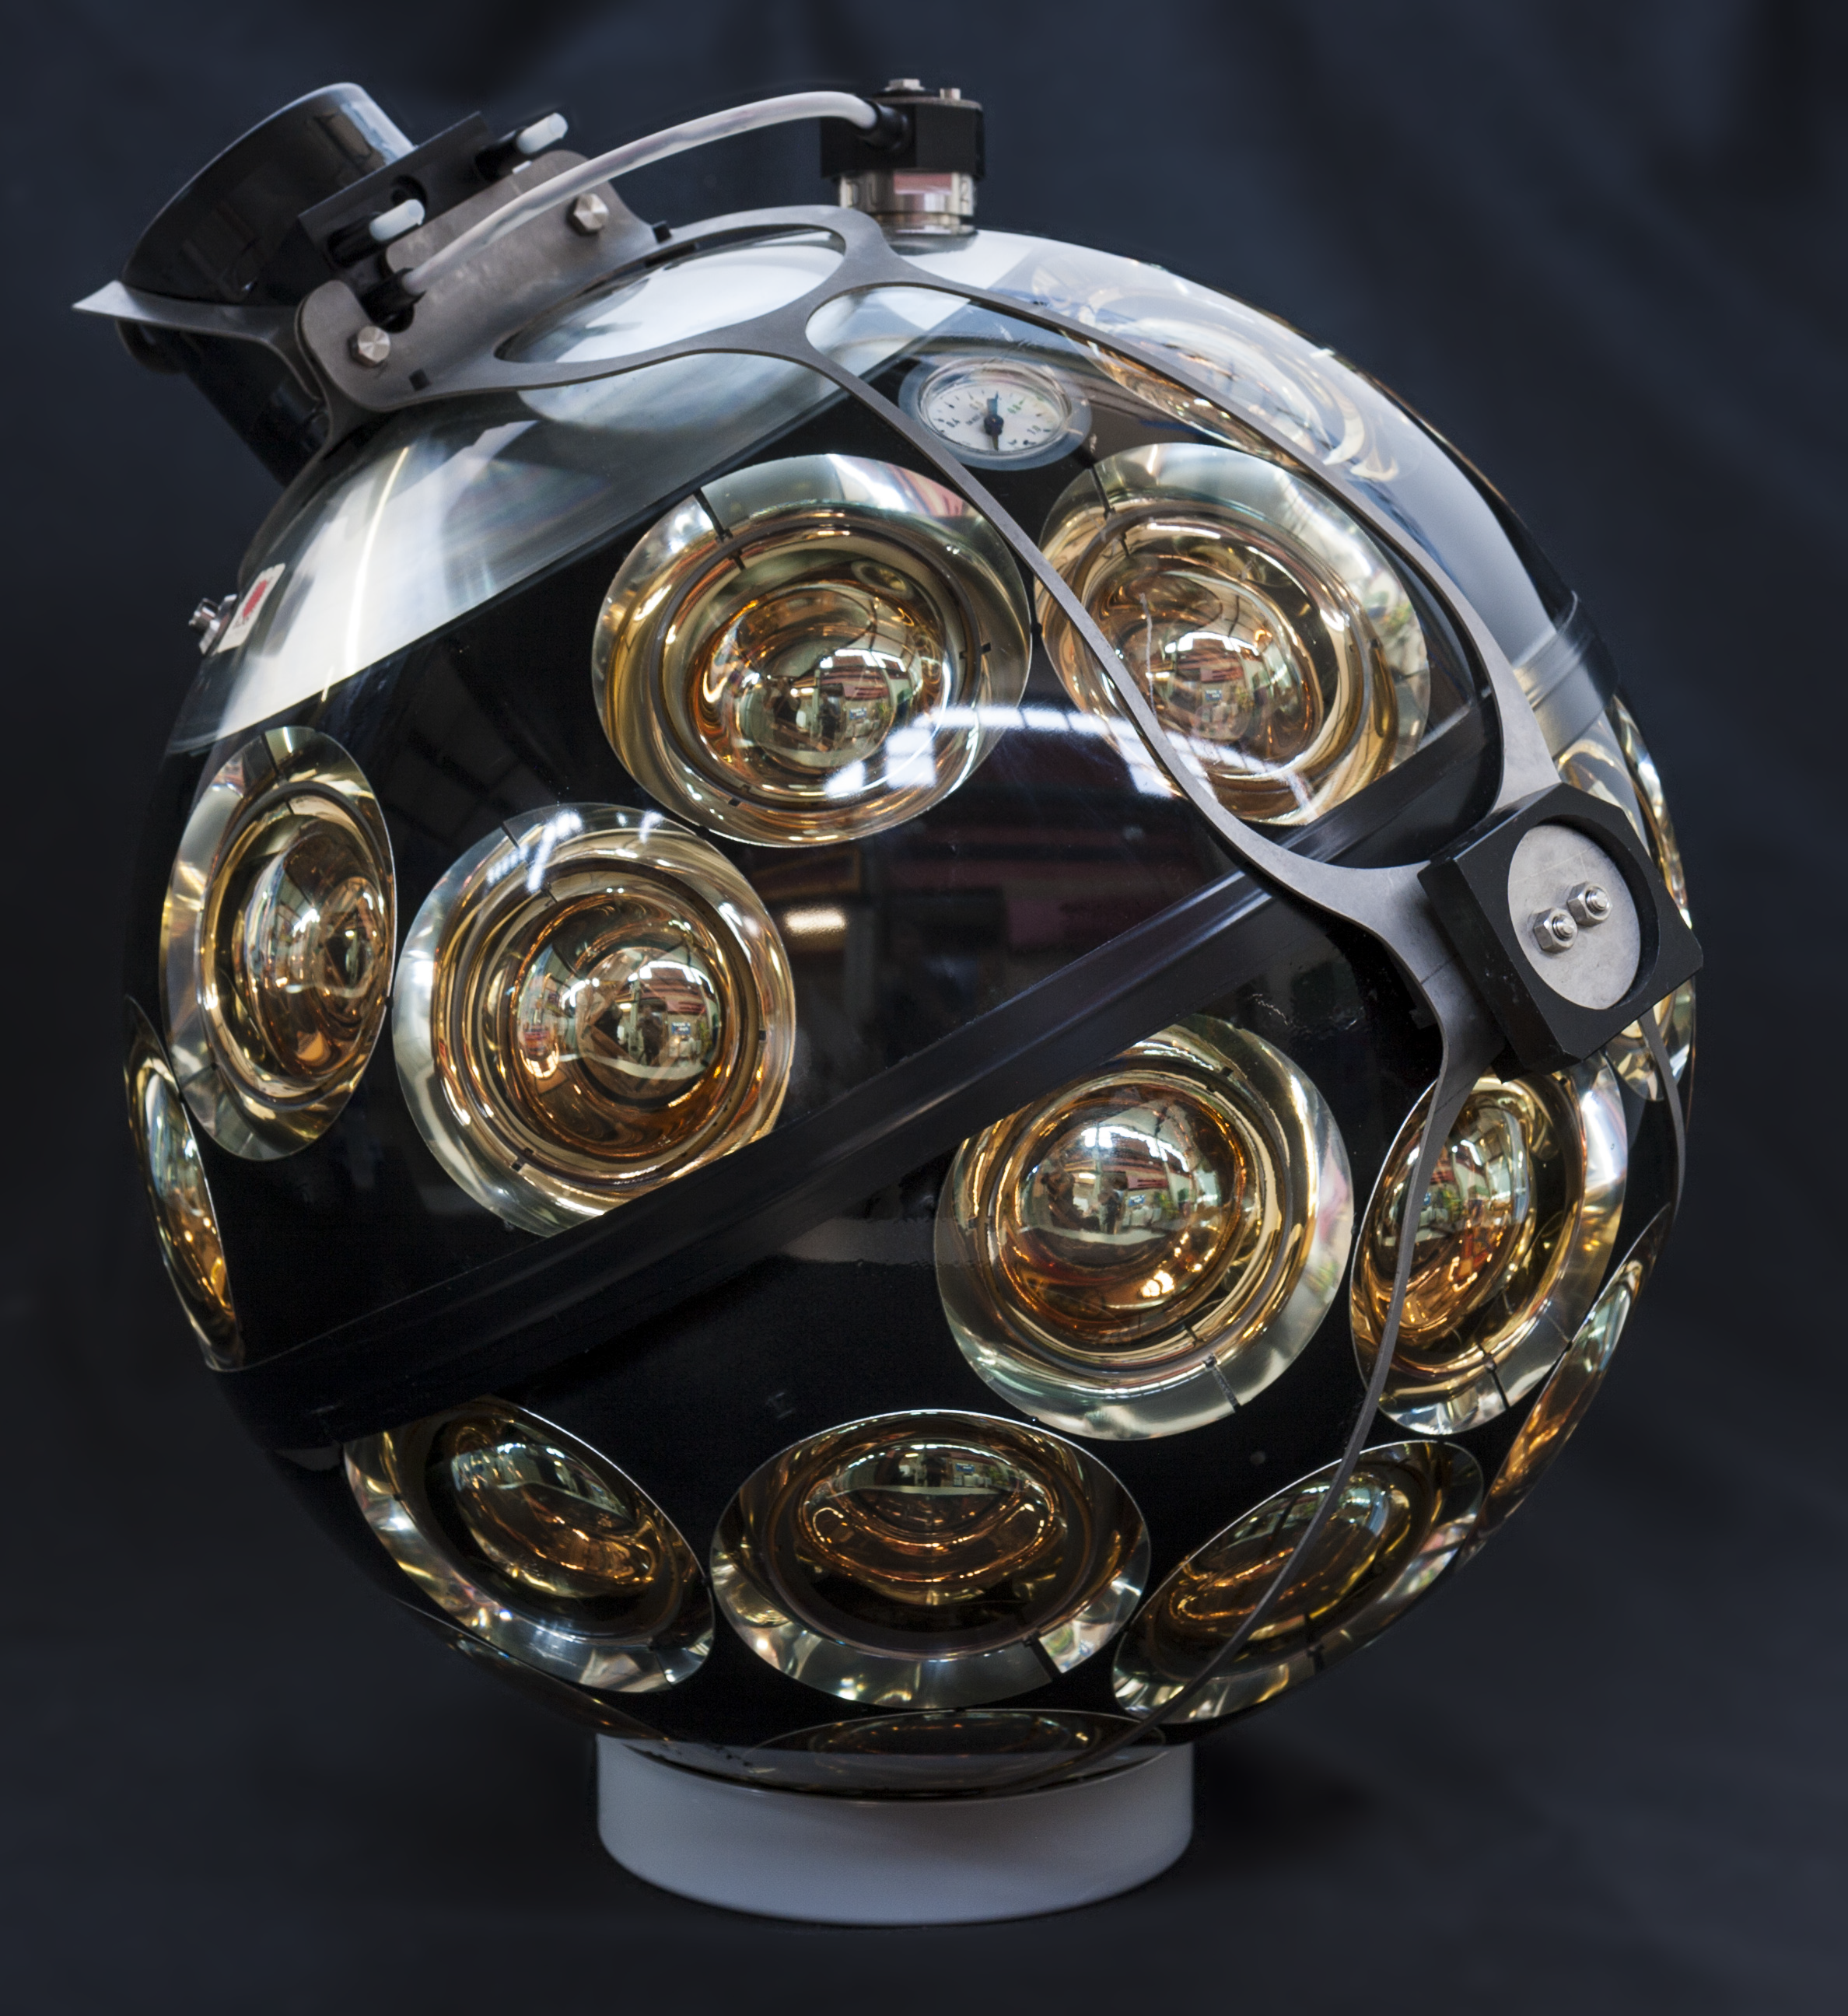
\(31\) three-inch PMTs.
Courtesy KM3NeT.
Baikal-GVD
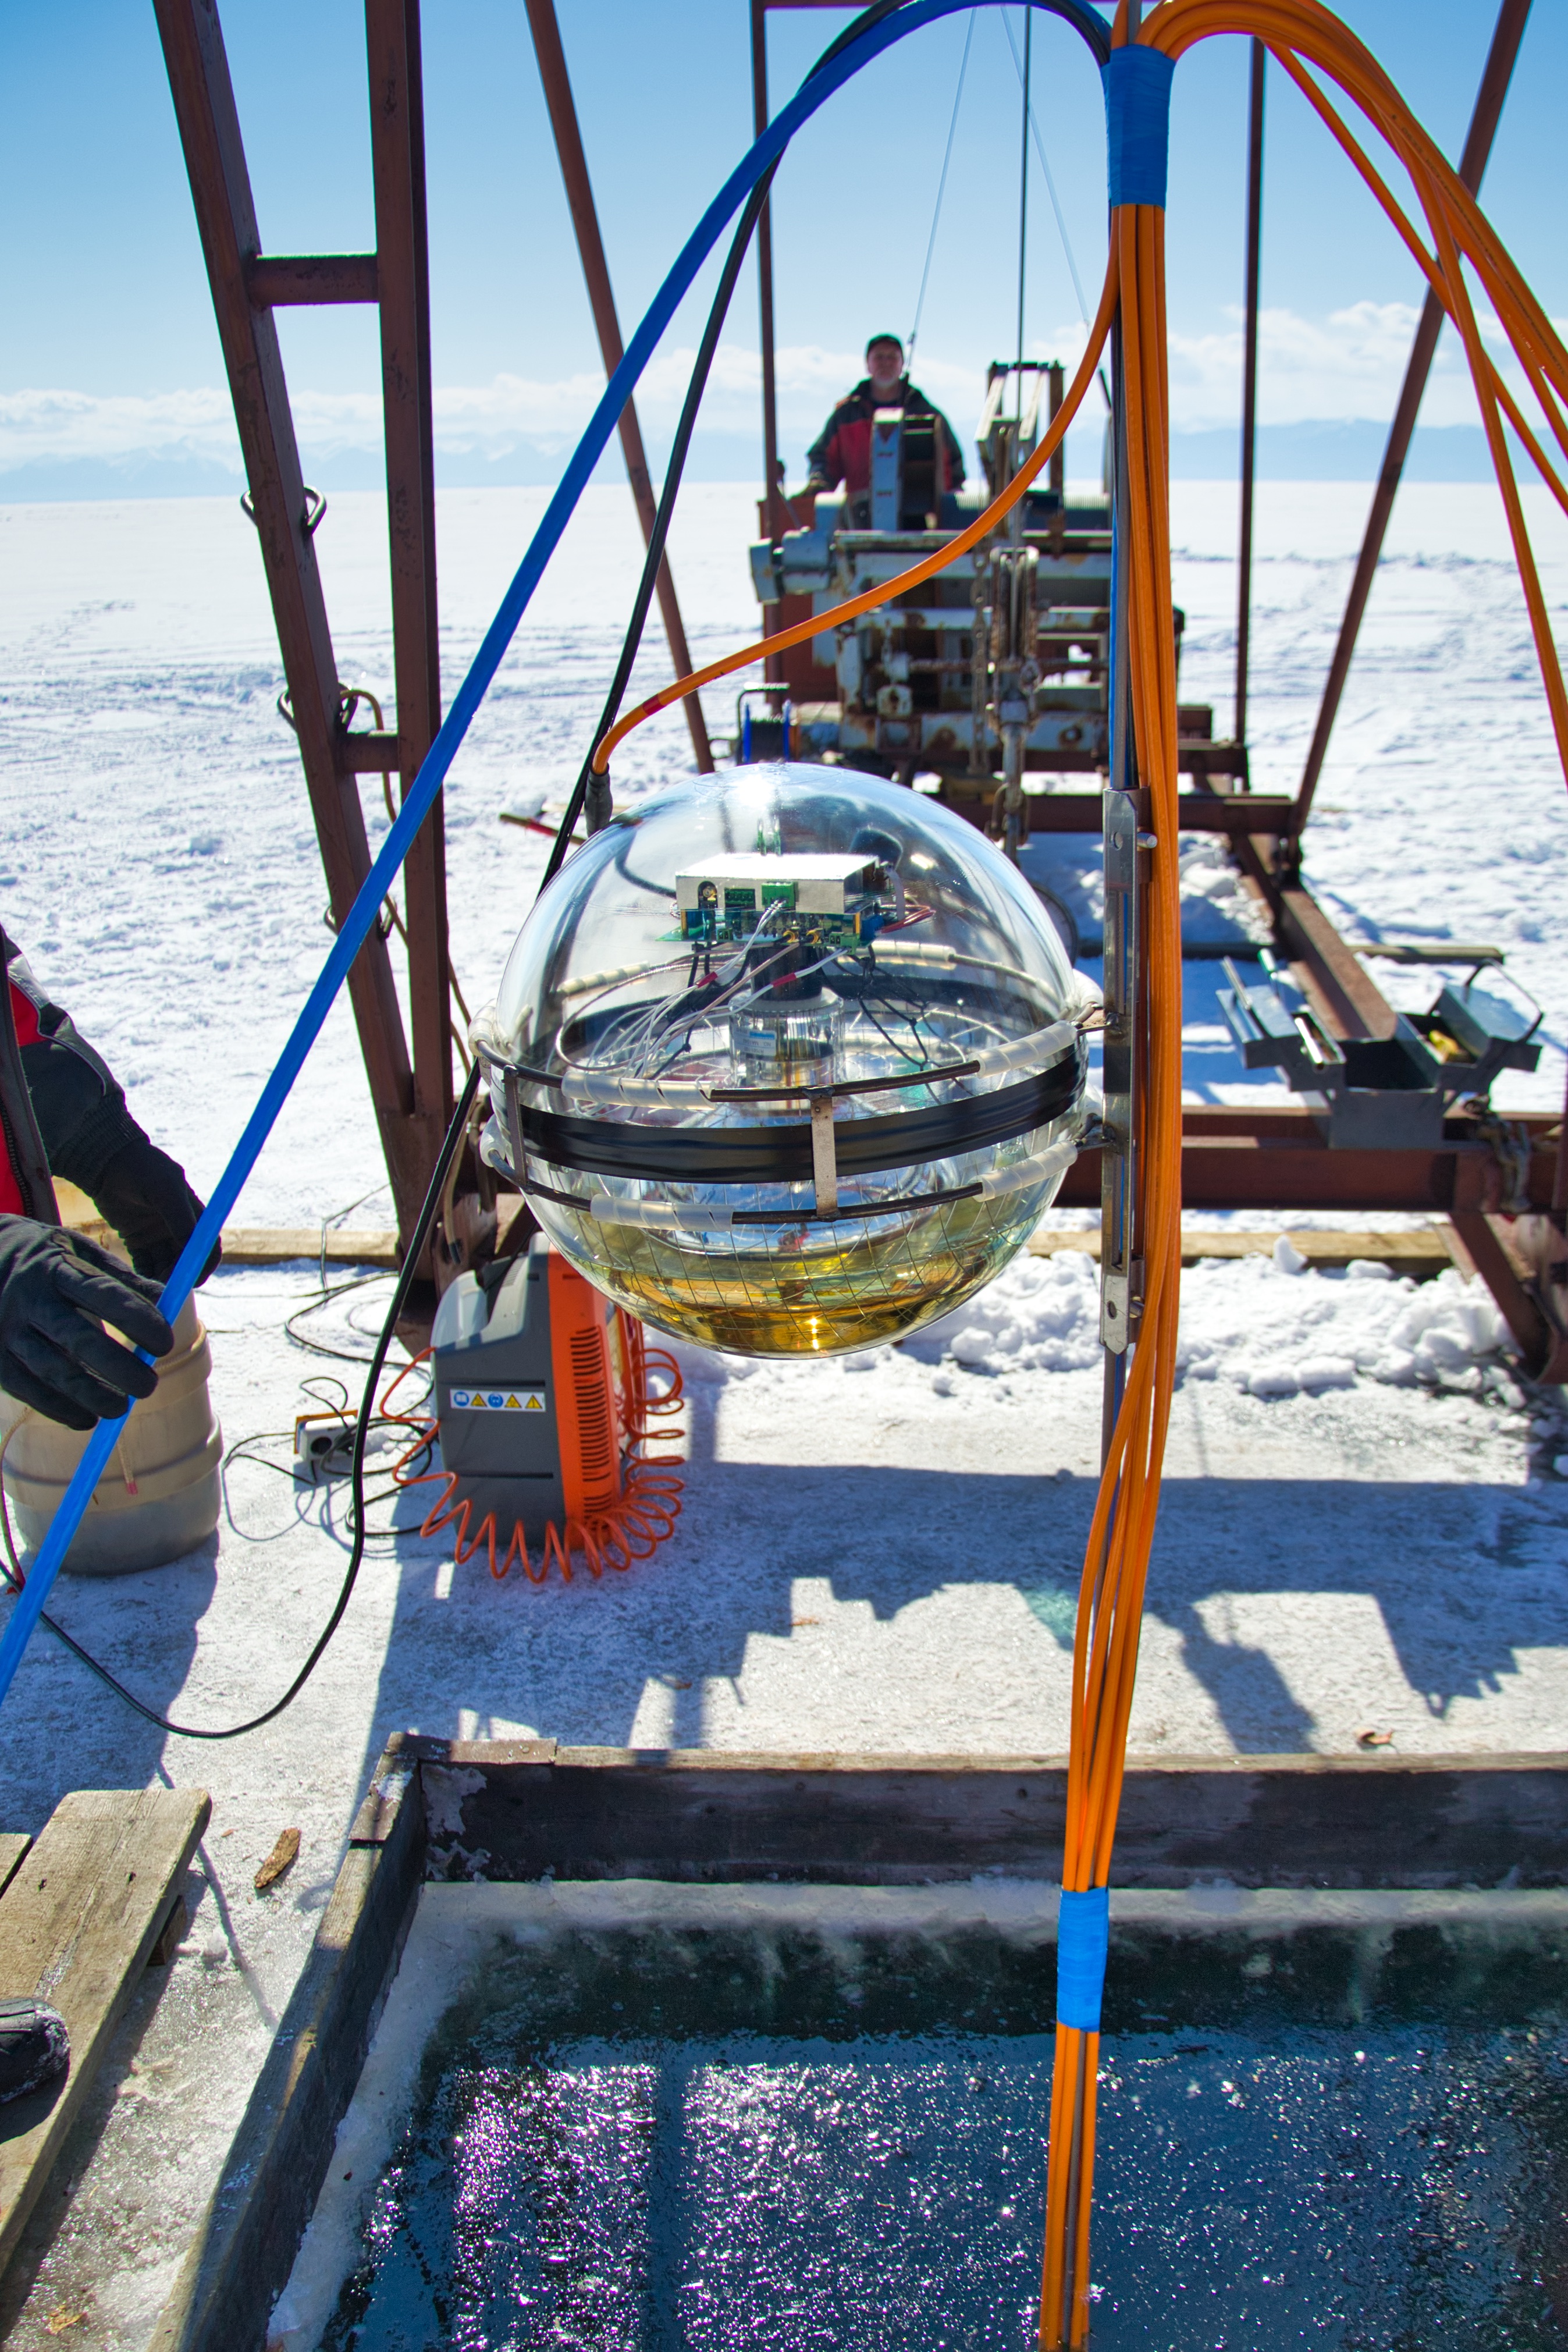
One \(10\,\mathrm{inch}\) PMT.
Baikal-GVD; supplied by DN.
TRIDENT
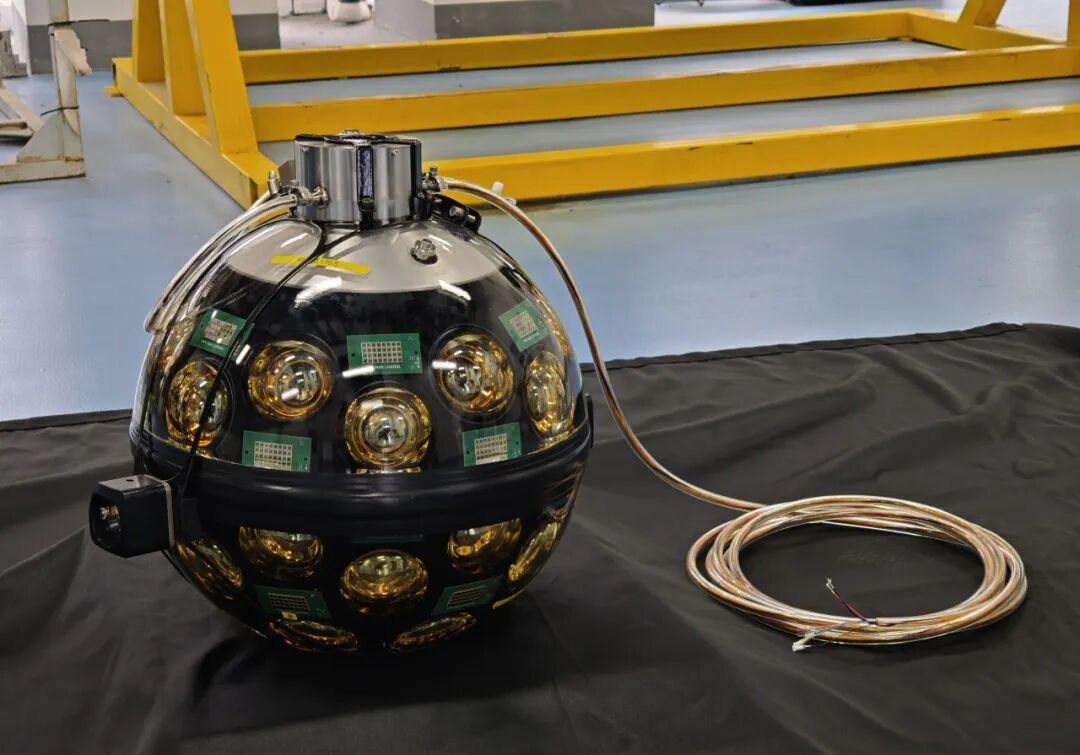
PMTs + SiPMs. Prototype.
TRIDENT / TDLI, SJTU.
Backgrounds
| Telescope | Optical background | Pulses / PMT | Muon-dominated samples |
|---|---|---|---|
| IceCube | PMT + glass noise | \(0.56\,\mathrm{kHz}\) · 10-inch | \(2.7\,\mathrm{kHz}\) · IC86 DAQ |
| KM3NeT | \(^{40}\mathrm K\) + bioluminescence | \(\sim7\,\mathrm{kHz}\) · 3-inch | \(\sim1\,\mathrm{Hz}\) · ARCA6 reconstructed |
| Baikal-GVD | Water luminescence | \(20–100\,\mathrm{kHz}\) · 10-inch | \(\sim3\,\mathrm{Hz/cluster}\) · reconstructed |
Pulses, DAQ triggers and reconstructed events are different counting levels. IceCube · KM3NeT · Baikal-GVD
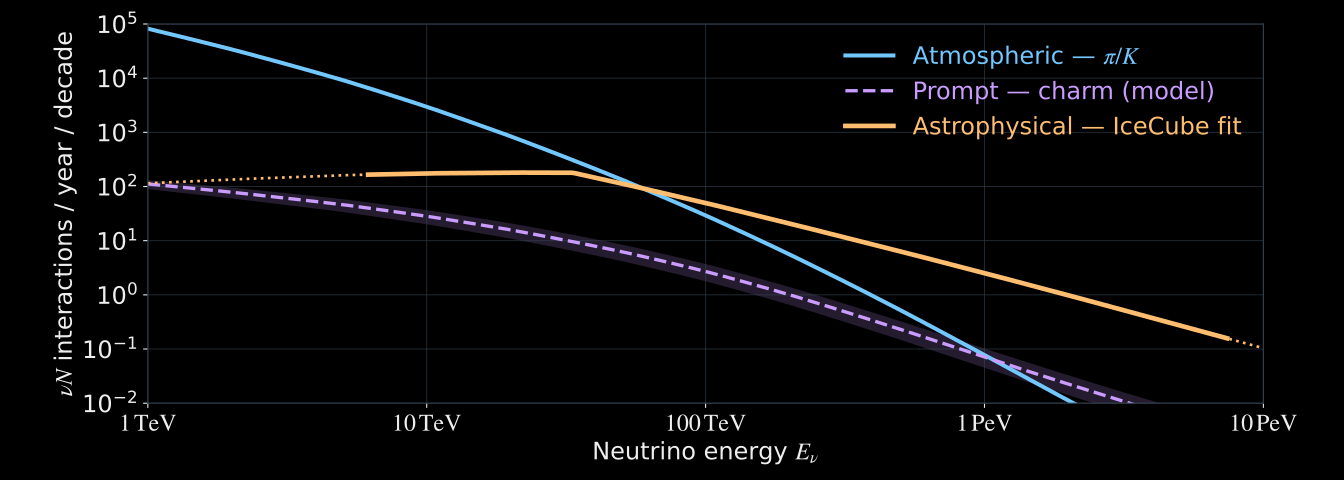
\(1\,\mathrm{km^3}\) water · downward \(2\pi\) · all flavours, \(\nu+\bar\nu\) · CC+NC · before selection.
From events to a neutrino flux
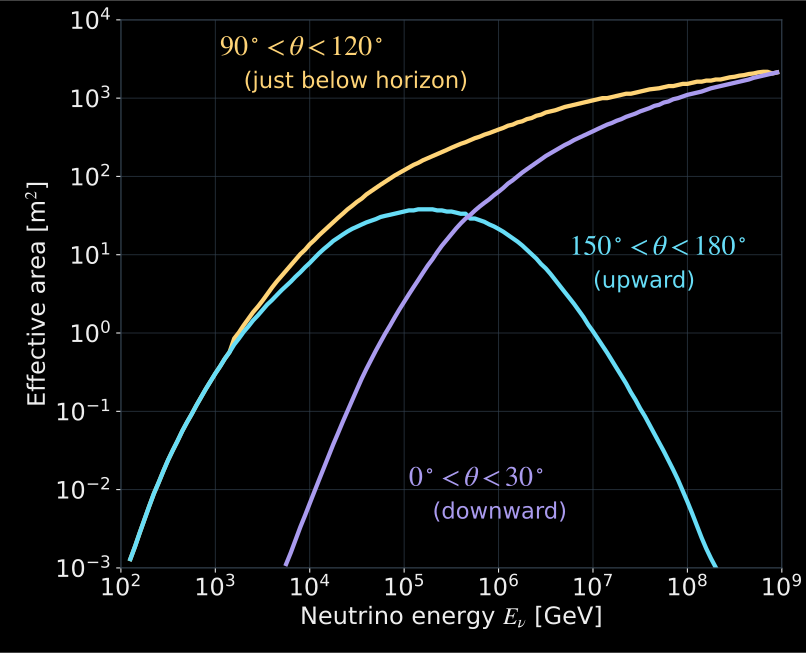
Near the horizon: short Earth chord.
Upward: Earth absorption at high energy.
Downward: atmospheric-muon rejection.
\(A_{\mathrm{eff}}\) includes interaction, propagation and event selection.
\[ N=T\sum_\alpha\int dE_\nu\,d\Omega\, \Phi_\alpha(E_\nu,\Omega)\,A_{\mathrm{eff},\alpha}(E_\nu,\Omega) \]
Illustrative point-source selection · Redrawn, digitized from Spiering (2026), Fig. 6
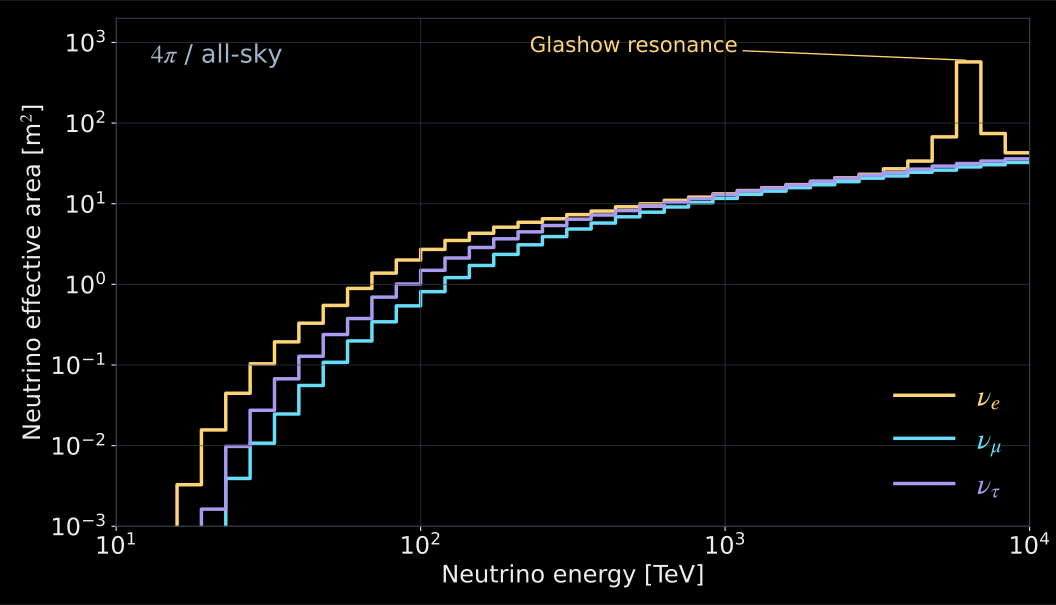
A specific sample
- Start inside the fiducial volume.
- Reject early light at the boundary.
- The accepted events determine the response used in the flux fit.
Historical HESE selection, 2010–2012 · Redrawn, digitized from IceCube (2013), Fig. 7
| Event | Light constrains | Parent-neutrino inference |
|---|---|---|
| Contained \(\nu_e\) CC | Electromagnetic + hadronic deposits | \(E_{\mathrm{dep}}\simeq E_\nu\), after response calibration |
| Through-going \(\mu\) | Muon energy losses inside the array | \(E_\mu\) at the detector, then a spectrum-dependent \(E_\nu\) distribution |
| Neutral current | Hadronic deposit | \(E_{\mathrm{dep}}\sim yE_\nu\); outgoing neutrino is unseen |
Historical HESE reconstruction (2013): tracks \(<1^\circ\); cascades \(10–15^\circ\).
Quoted median angular scales above about \(50\,\mathrm{TeV}\). Neutrino–muon kinematics adds a separate spread.
\(y\): inelasticity · IceCube reconstruction (2013)
Point-source searches: Baikal-GVD
988 tracks · 92 directions · April 2019–March 2024
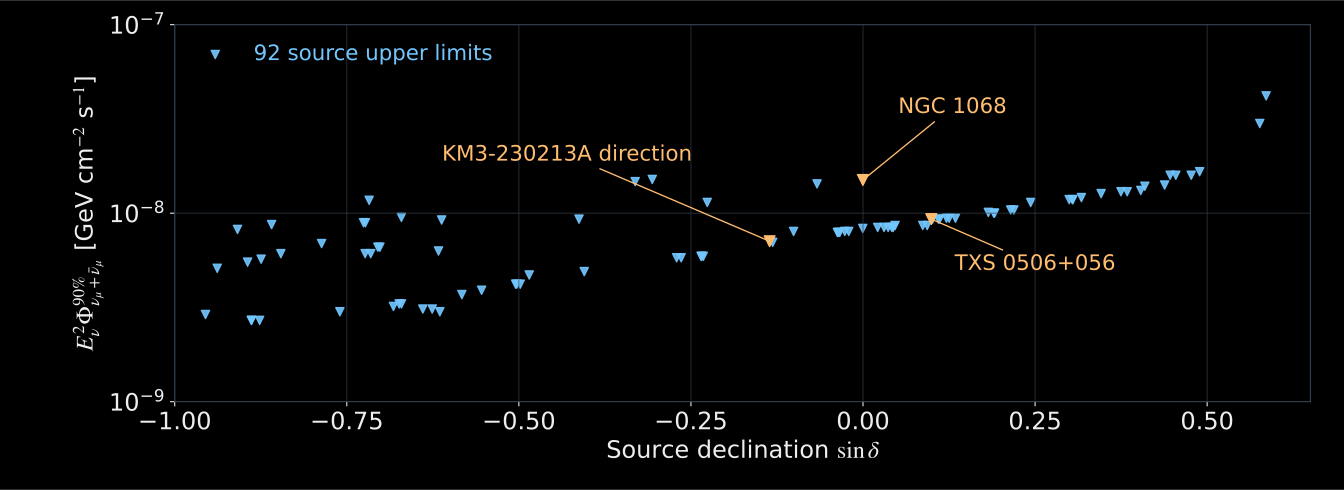
\(E^{-2}\) spectrum · \(90\%\) CL · No significant catalogue excess · Baikal-GVD (2026), Table 1
Real-time alerts and multimessenger follow-up with Baikal-GVD: work in progress.
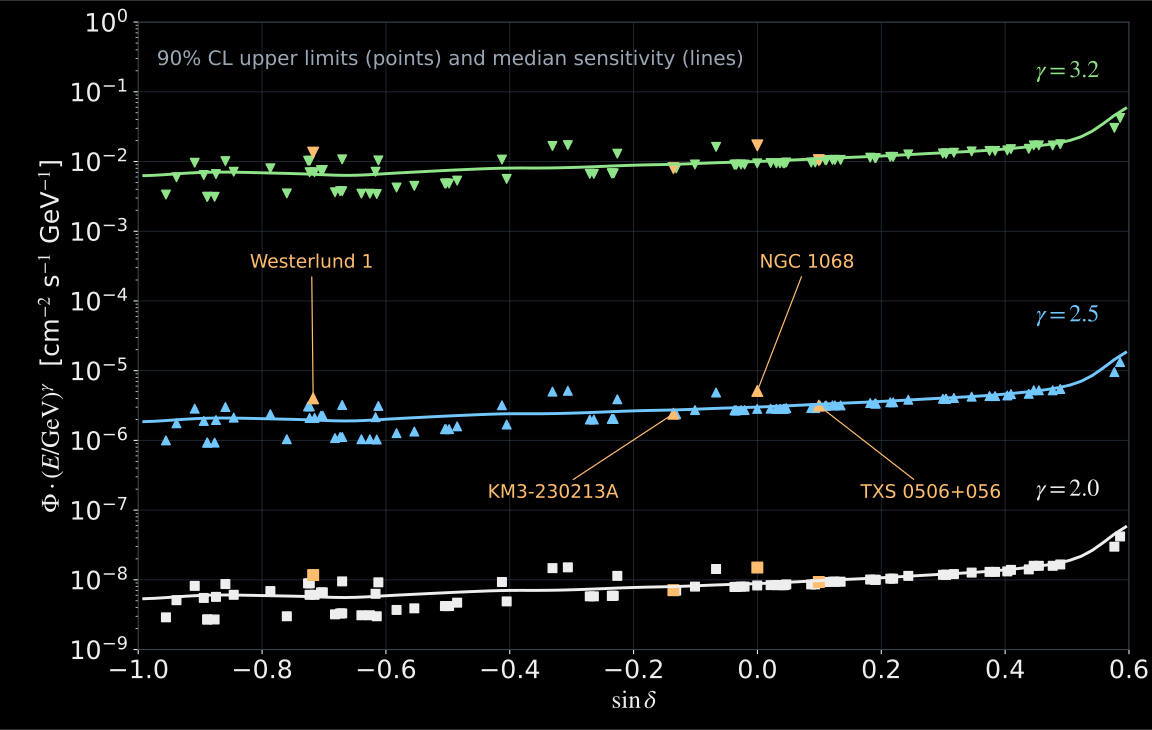
Symbols: source limits · Lines: expected sensitivity · Baikal-GVD (2026), Fig. 2 · Limits from Table 1, sensitivities redrawn from the vector artwork
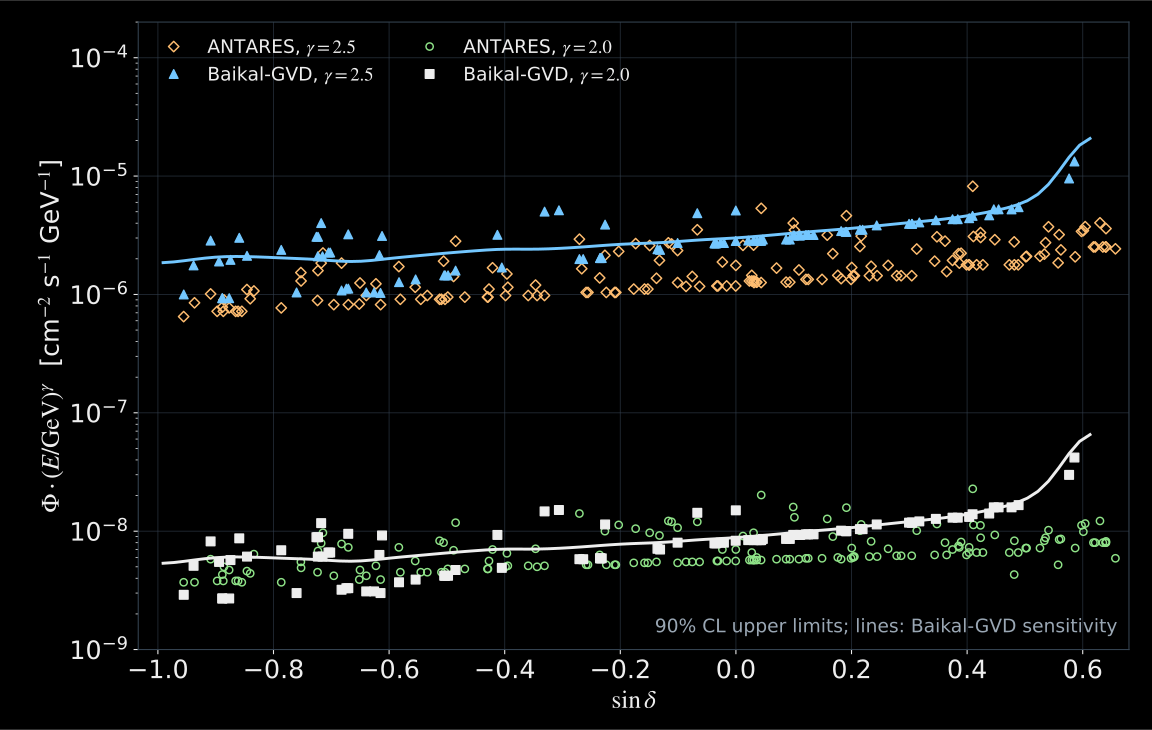
Matched spectral assumptions · Baikal-GVD Collaboration (2026), Fig. 3 · Redrawn from the vector artwork; Baikal-GVD limits from Table 1
A global view of the neutrino sky
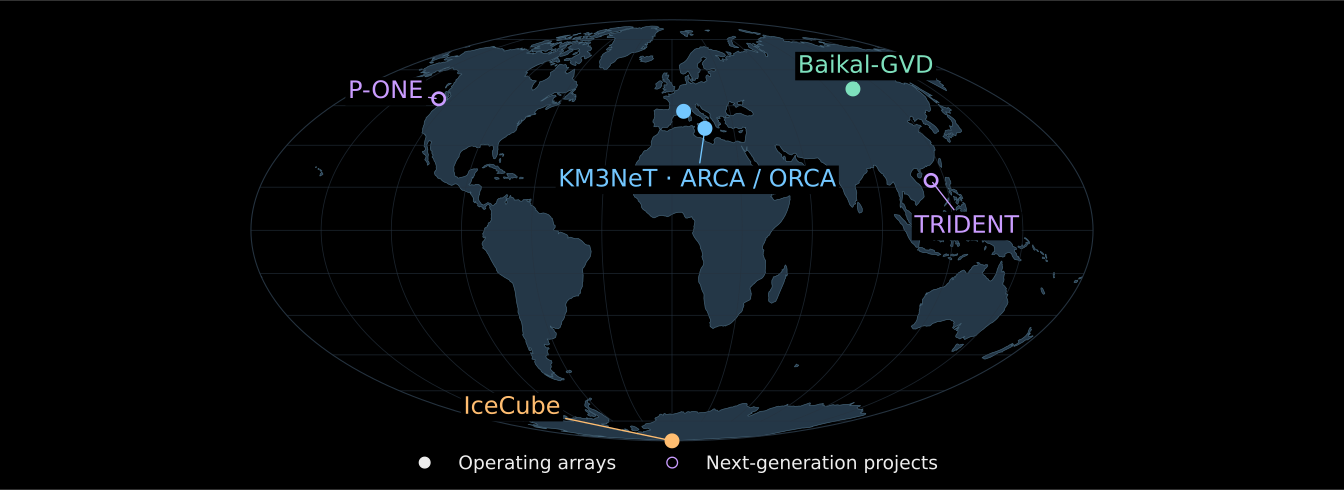
Site overview · October 2026 · coastlines: Natural Earth
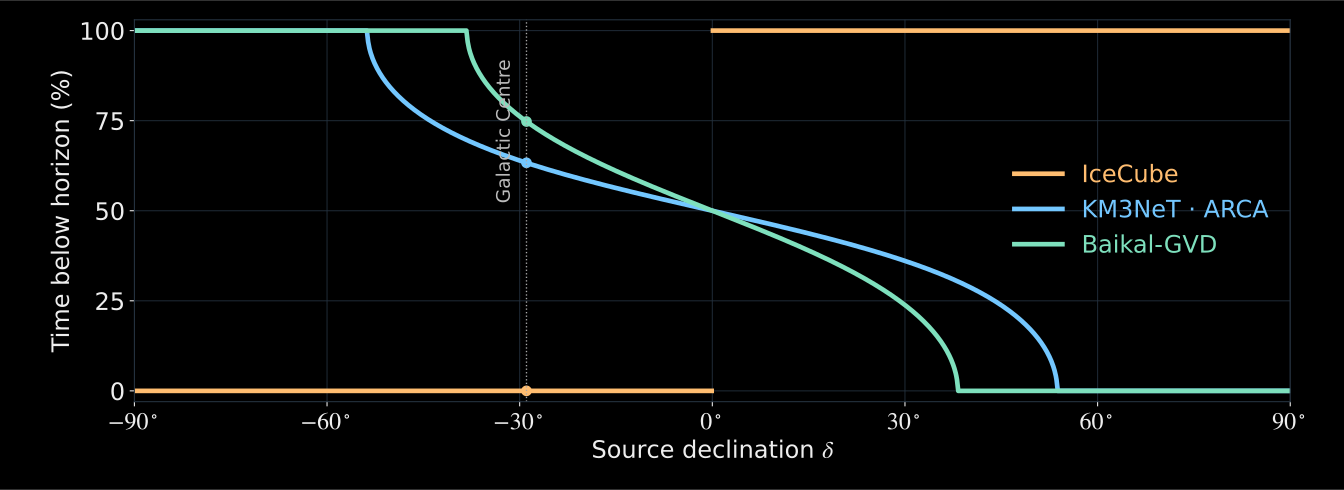
Geometry only, not sensitivity · IceCube also observes the southern sky with starting and contained events.
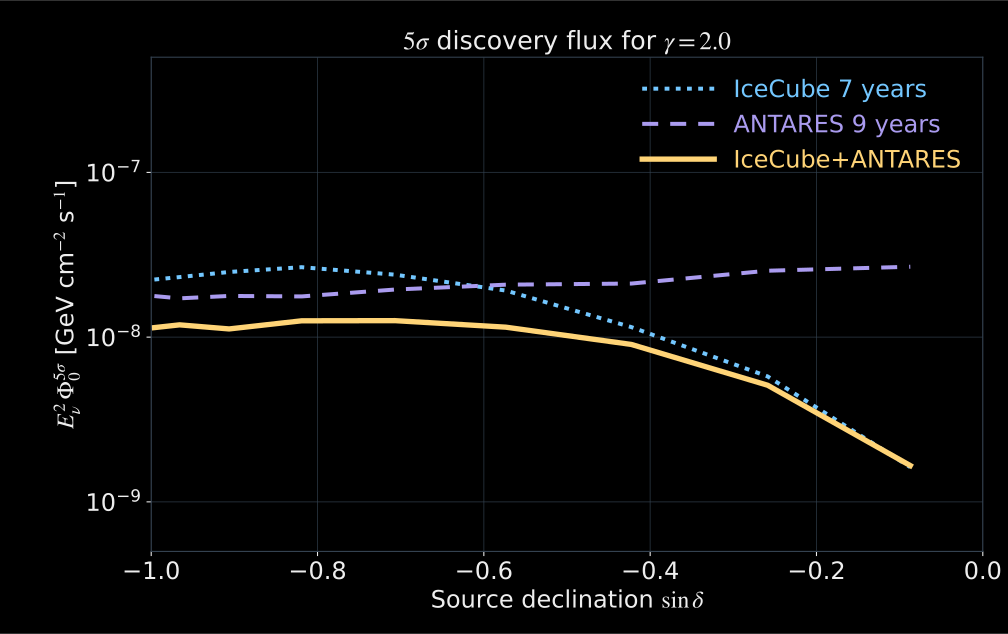
IceCube · 7 years
ANTARES · 9 years
- Gold: joint analysis.
- Lower flux = better discovery potential.
- Assumed spectrum: \(E^{-2}\).
Published joint analysis, not a next-generation projection · Redrawn, digitized from ANTARES & IceCube (2020), Fig. 2