viewof sigma = Inputs.range([0.3, 2.0], {
  value: 1.0,
  step: 0.02,
  label: "trial σ"
})

viewof nEvents = Inputs.range([200, 5000], {
  value: 1000,
  step: 100,
  label: "N"
})

viewof regenerate = Inputs.button("Новые псевдоданные")

viewof overlays = {
  const panel = html`<div class="fit-overlays-inline">
    <label>показать лучший фит <input name="showFit" type="checkbox"></label>
    <label>истинное σ <input name="showTruth" type="checkbox"></label>
  </div>`;
  const fitInput = panel.querySelector('input[name="showFit"]');
  const truthInput = panel.querySelector('input[name="showTruth"]');
  const sync = () => {
    panel.value = {
      showFit: fitInput.checked,
      showTruth: truthInput.checked
    };
  };
  const notify = () => {
    sync();
    panel.dispatchEvent(new Event("input", {bubbles: true}));
  };
  fitInput.addEventListener("change", notify);
  truthInput.addEventListener("change", notify);
  sync();
  return panel;
}

// Gaussian random number (Box-Muller)
function randn() {
  const u = 1 - Math.random();
  const v = Math.random();
  return Math.sqrt(-2 * Math.log(u)) * Math.cos(2 * Math.PI * v);
}

// Fixed x values
x = Array.from({length: 21}, (_, i) => -2.5 + 0.25 * i)
dx = 0.25
xMin = x[0] - dx / 2
xMax = x[x.length - 1] + dx / 2
binEdges = Array.from({length: x.length + 1}, (_, i) => xMin + i * dx)

// True sigma (hidden by default)
sigmaTrue = {
  regenerate;
  return 0.5 + Math.random();
}

// Generate events x~N(0, sigmaTrue) and fill histogram bins
function generateCountsGaussian(s, nTot) {
  const counts = Array(x.length).fill(0);
  let accepted = 0;
  while (accepted < nTot) {
    const xi = s * randn();
    if (xi < xMin || xi >= xMax) continue;
    const ibin = Math.floor((xi - xMin) / dx);
    counts[Math.max(0, Math.min(x.length - 1, ibin))] += 1;
    accepted += 1;
  }
  return counts;
}

counts = {
  regenerate;
  nEvents;
  return generateCountsGaussian(sigmaTrue, nEvents);
}

nTotal = counts.reduce((sum, n) => sum + n, 0)
countMax = Math.max(1, ...counts)

data = x.map((xi, i) => {
  const n = counts[i];
  return {
    x: xi,
    n,
    y: n / countMax,
    err: Math.sqrt(Math.max(n, 1)) / countMax
  };
})

gaussShape = (xx, s) => Math.exp(-(xx * xx) / (2 * s * s))

normCurve = (s) => {
  const w = x.map((xi) => gaussShape(xi, s));
  const wMax = Math.max(...w, 1e-12);
  return x.map((xi, i) => ({x: xi, y: w[i] / wMax}));
}

function erfApprox(xx) {
  const sign = xx < 0 ? -1 : 1;
  const xAbs = Math.abs(xx);
  const p = 0.3275911;
  const a1 = 0.254829592;
  const a2 = -0.284496736;
  const a3 = 1.421413741;
  const a4 = -1.453152027;
  const a5 = 1.061405429;
  const t = 1 / (1 + p * xAbs);
  const poly = (((((a5 * t + a4) * t + a3) * t + a2) * t + a1) * t);
  const y = 1 - poly * Math.exp(-(xAbs * xAbs));
  return sign * y;
}

normalCdf = (z) => 0.5 * (1 + erfApprox(z / Math.SQRT2))

binProbabilities = (s) => {
  const sSafe = Math.max(s, 1e-6);
  const cdf = (xx) => normalCdf(xx / sSafe);
  const norm = Math.max(cdf(xMax) - cdf(xMin), 1e-12);
  return x.map((_, i) => (cdf(binEdges[i + 1]) - cdf(binEdges[i])) / norm);
}

modelCounts = (s) => {
  const probs = binProbabilities(s);
  return probs.map((p) => nTotal * p);
}

chi2of = (s) => {
  const mu = modelCounts(s);
  return counts.reduce((sum, n, i) => {
    const m = Math.max(mu[i], 1e-12);
    if (n > 0) return sum + 2 * (m - n + n * Math.log(n / m));
    return sum + 2 * m;
  }, 0);
}

chi2 = chi2of(sigma)

sigmaGrid = Array.from({length: 341}, (_, i) => 0.30 + 0.005 * i)
chi2Grid = sigmaGrid.map((s) => ({sigma: s, chi2: chi2of(s)}))
best = chi2Grid.reduce((a, b) => (a.chi2 < b.chi2 ? a : b))
sigmaFit = best.sigma
chi2min = best.chi2
ndf = Math.max(data.length - 1, 1)
dchi2 = chi2 - chi2min

trialCurve = normCurve(sigma)
fitCurve = normCurve(sigmaFit)
trueCurve = normCurve(sigmaTrue)

mutable history = []
historyReset = {
  counts;
  mutable history = [];
  return null;
}

historyUpdate = {
  const h = history;
  const last = h.length > 0 ? h[h.length - 1] : null;
  const point = {sigma, chi2};

  if (!last || Math.abs(last.sigma - point.sigma) > 1e-9) {
    mutable history = [...h, point];
  }
  return null;
}

mainPlot = Plot.plot({
  width: 620,
  height: 320,
  x: {label: "x"},
  y: {label: "y", domain: [-0.1, 1.2]},
  grid: true,
  marks: [
    Plot.ruleX(data, {
      x: "x",
      y1: (d) => d.y - d.err,
      y2: (d) => d.y + d.err,
      stroke: "white",
      strokeWidth: 1.5
    }),
    Plot.dot(data, {x: "x", y: "y", r: 3.5, fill: "white", stroke: "white"}),
    Plot.line(trialCurve, {x: "x", y: "y", stroke: "#ff6b6b", strokeWidth: 2}),
    ...(overlays.showTruth ? [
      Plot.line(trueCurve, {
        x: "x",
        y: "y",
        stroke: "#8ec5ff",
        strokeWidth: 2,
        strokeOpacity: 0.85
      })
    ] : []),
    ...(overlays.showFit ? [
      Plot.line(fitCurve, {
        x: "x",
        y: "y",
        stroke: "#7CFC00",
        strokeWidth: 2,
        strokeDasharray: "6,4"
      })
    ] : [])
  ]
})

profilePlot = Plot.plot({
  width: 280,
  height: 200,
  x: {label: "σ", domain: [0.3, 2.0]},
  y: {label: "χ²", domain: [0, 50]},
  grid: true,
  marks: [
    Plot.dot(history.slice(0, -1), {
      x: "sigma",
      y: "chi2",
      fill: "gray",
      r: 2.8
    }),
    Plot.dot([{sigma, chi2}], {
      x: "sigma",
      y: "chi2",
      fill: "#ff6b6b",
      r: 5
    }),
    ...(overlays.showFit ? [
      Plot.line(chi2Grid, {
        x: "sigma",
        y: "chi2",
        stroke: "#8ec5ff",
        strokeOpacity: 0.75
      }),
      Plot.dot([{sigma: sigmaFit, chi2: chi2min}], {
        x: "sigma",
        y: "chi2",
        fill: "#7CFC00",
        r: 5
      })
    ] : [])
  ]
})

fitStyle = html`
<style>
.fit-widget .observablehq--inspect {
  display: none !important;
}

.fit-widget .observablehq {
  margin: 0.12rem 0;
}

.fit-widget label {
  display: inline-flex;
  align-items: center;
  gap: 0.45rem;
  font-size: 1.03em;
}

.fit-widget label > span:first-child {
  min-width: 11.2rem;
}

.fit-widget input[type="number"] {
  width: 6.0rem !important;
}

.fit-widget input[type="range"] {
  width: 210px !important;
  accent-color: #ffb347;
  background: transparent !important;
}

.fit-widget input[type="range"]::-webkit-slider-runnable-track {
  height: 6px;
  border-radius: 999px;
  background: #46637b;
}

.fit-widget input[type="range"]::-webkit-slider-thumb {
  -webkit-appearance: none;
  width: 14px;
  height: 14px;
  border-radius: 50%;
  border: 1px solid #1f2e3a;
  background: #ffb347;
  margin-top: -4px;
}

.fit-widget input[type="range"]::-moz-range-track {
  height: 6px;
  border: none;
  border-radius: 999px;
  background: #46637b;
}

.fit-widget input[type="range"]::-moz-range-thumb {
  width: 14px;
  height: 14px;
  border-radius: 50%;
  border: 1px solid #1f2e3a;
  background: #ffb347;
}

.fit-widget .fit-overlays-inline {
  display: flex;
  align-items: center;
  gap: 1rem;
  flex-wrap: nowrap;
  margin: 0.1rem 0 0.45rem;
}

.fit-widget .fit-overlays-inline label {
  display: inline-flex;
  align-items: center;
  gap: 0.35rem;
  margin: 0;
  white-space: nowrap;
}

.fit-widget .fit-overlays-inline input[type="checkbox"] {
  margin: 0;
}

.fit-widget .fit-layout {
  display: grid;
  grid-template-columns: minmax(0, 1fr) 280px;
  gap: 0.8rem;
  align-items: start;
}

.fit-widget .fit-main figure,
.fit-widget .fit-side figure {
  margin: 0;
}

.fit-widget .fit-summary {
  margin-top: 0.45rem;
  font-size: 0.78em;
  line-height: 1.35;
}

.fit-widget .fit-summary-label {
  font-weight: 700;
}

.fit-widget .fit-summary-choice {
  color: #ff6b6b;
}

.fit-widget .fit-summary-fit {
  color: #7CFC00;
}

.fit-widget .fit-summary-truth {
  color: #8ec5ff;
}

@media (max-width: 980px) {
  .fit-widget .fit-layout {
    grid-template-columns: 1fr;
  }
}
</style>
`

html`
<div>
  ${fitStyle}
  <div class="fit-layout">
    <div class="fit-main">
      ${mainPlot}
    </div>
    <div class="fit-side">
      ${profilePlot}
    </div>
  </div>
  <div class="fit-summary">
    <div>
      <span class="fit-summary-label fit-summary-choice">Ваш выбор:</span>
      N = ${nEvents},
      σ = ${sigma.toFixed(2)},
      χ²/ndf = ${(chi2 / ndf).toFixed(2)}
    </div>
    ${overlays.showFit ? `
    <div>
      <span class="fit-summary-label fit-summary-fit">Лучший фит:</span>
      σ_fit = ${sigmaFit.toFixed(3)},
      χ²_min/ndf = ${(chi2min / ndf).toFixed(2)}
    </div>` : ``}
    ${overlays.showTruth ? `
    <div>
      <span class="fit-summary-label fit-summary-truth">Истинное σ:</span>
      σ_true = ${sigmaTrue.toFixed(3)}
    </div>` : ``}
  </div>
</div>
`Лекция 1. Мотивация и обзор курса
Статистический анализ данных
Дмитрий В. Наумов (ОИЯИ)
Важное замечание
- Я не профессиональный статистик. Я физик, который применяет статистический анализ на практике.
- На курсе мы разберем ключевые концепции, приемы и язык, на котором физики обсуждают результаты:
- Я обнаружил сигнал со значимостью 5 \(\sigma\)!
- Мы наблюдаем избыток в данных.
- Значимого избытка не наблюдается.
- Мы исключаем эту область параметров на уровне 95% C.L.
- Мы устанавливаем верхний предел на сечение.
- Фит хорошо сошелся.
- Доминирующая неопределенность является систематической.
- Корреляции между бинами важны.
- Эти nuisance-параметры были профилированы в фите.
- Нужно использовать полную ковариационную матрицу.
Обозначения
Скалярные величины обозначаются курсивом: \(x\), \(y\), \(\theta\)
Векторы обозначаются полужирным шрифтом: \(\mathbf{x}=(x_1,x_2,\dots,x_n)\)
Матрицы обозначаются полужирными заглавными буквами: \(\mathbf{V}\), \(\mathbf{M}\)
Случайные величины обозначаются заглавными буквами: \(X\), \(Y\)
Их наблюденные значения обозначаются строчными буквами: \(x\), \(y\)
Вероятность события \(A\) обозначается как \(P(A)\)
Функция плотности вероятности обозначается как \(f(x)\) или \(p(x)\)
Параметры модели обозначаются через \(\theta\)
Оценки параметров обозначаются через \(\hat{\theta}\)
Обозначения (продолжение)
Математическое ожидание: \(\mathbb{E}[X]\)
Дисперсия: \(\mathrm{Var}(X)\)
Стандартное отклонение: \(\sigma_X=\sqrt{\mathrm{Var}(X)}\)
Ковариация: \(\mathrm{cov}(X,Y)\)
Коэффициент корреляции: \(\rho(X,Y)\)
Частотный и байесовский подходы
Есть два основных подхода к интерпретации вероятности.
Относительная частота (Frequentist)
\(A\), \(B\), … , это исходы повторяемого эксперимента.\[ P(A)=\lim\limits_{n\to\infty}\frac{\text{число наблюдений исхода }A}{n} \]
Субъективная вероятность (Bayes)
\[ P(A)=\text{степень уверенности в истинности }A \]
\[ P(A\mid B)=\frac{P(B\mid A)\,P(A)}{P(B)} \]
На этом курсе мы в основном будем говорить о частотной статистике.
Литература
Particle Data Group: Review of statistics (2015)
G. Cowan, Statistical Data Analysis, Clarendon, Oxford, 1998
также: www.pp.rhul.ac.uk/~cowan/sdaR. J. Barlow, Statistics: A Guide to the Use of Statistical Methods in the Physical Sciences, Wiley, 1989
также: hepwww.ph.man.ac.uk/~roger/book.htmlL. Lyons, Statistics for Nuclear and Particle Physics, CUP, 1986
F. James, Statistical and Computational Methods in Experimental Physics, 2nd ed., World Scientific, 2006
Лекции G. Cowan с большим количеством материалов:
www.pp.rhul.ac.uk/~cowan/stat_course.html
Зачем нам статистика в физике?
Четыре основных шага
- Теория:
- Эффект закодирован в \(\mathbf{t}\).
- Пример: число бозонов Хиггса, рожденных на LHC.
- Эксперимент:
- Поиск эффекта. Наблюдаемое значение: \(\mathbf{d}\).
- Статистический анализ:
- Сравниваем ожидание модели \(\mathbf{t}\) с наблюдением \(\mathbf{d}\).
- Делаем вывод:
- теория подтверждается, это экспериментальное открытие.
- теория опровергается, область параметров исключается.
- Пишем статью.
Умеете ли вы читать такие типичные графики в современной физике?
Открытие бозона Хиггса
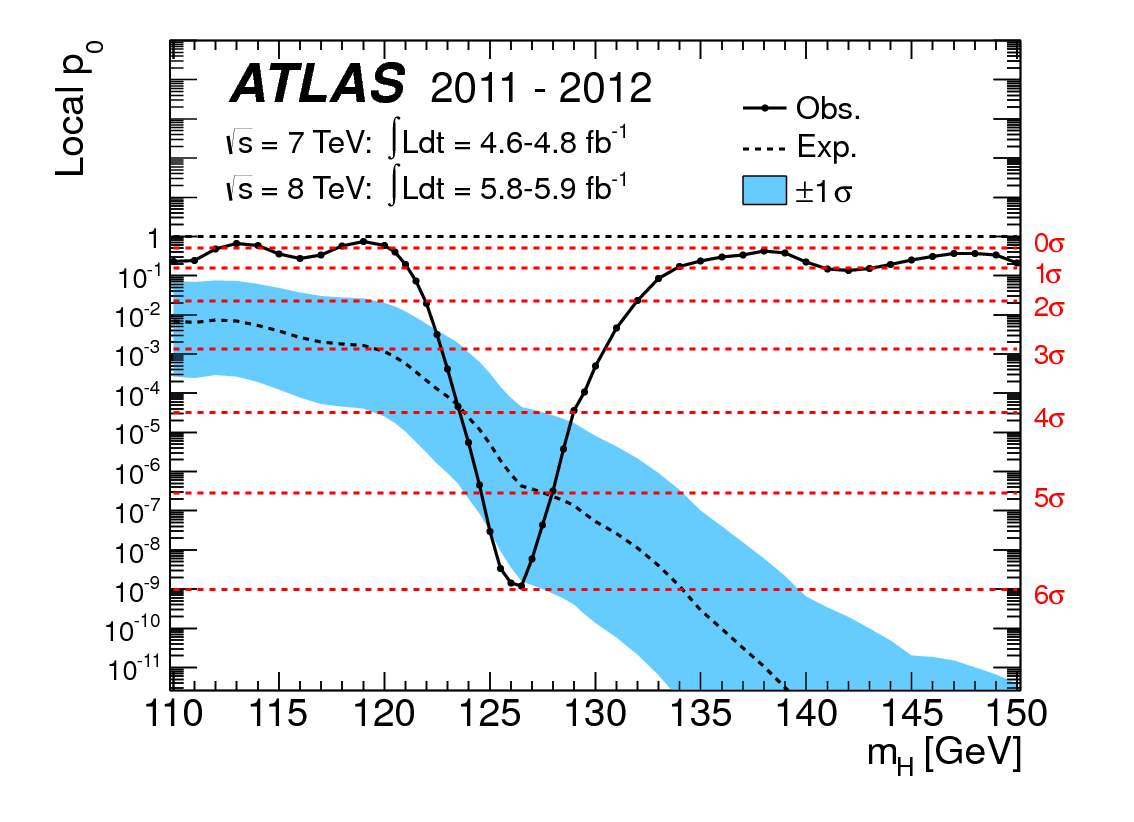
- Что такое
- \(p\)-value?
- \(\sigma\)?

Daya Bay: открытие ненулевого \(\theta_{13}\)
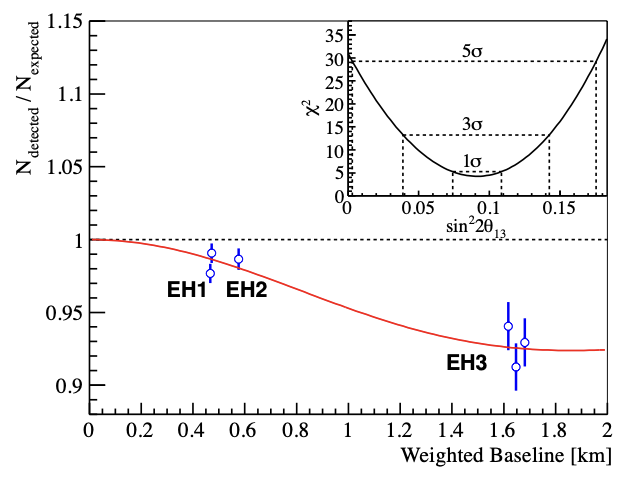
Опубликовано в: Phys.Rev.Lett. 108 (2012) 171803
- Что такое осцилляционный фит?
- Что такое значение best fit?
- Что такое статистическая значимость фита?
Daya Bay: исключение области параметров стерильного нейтрино
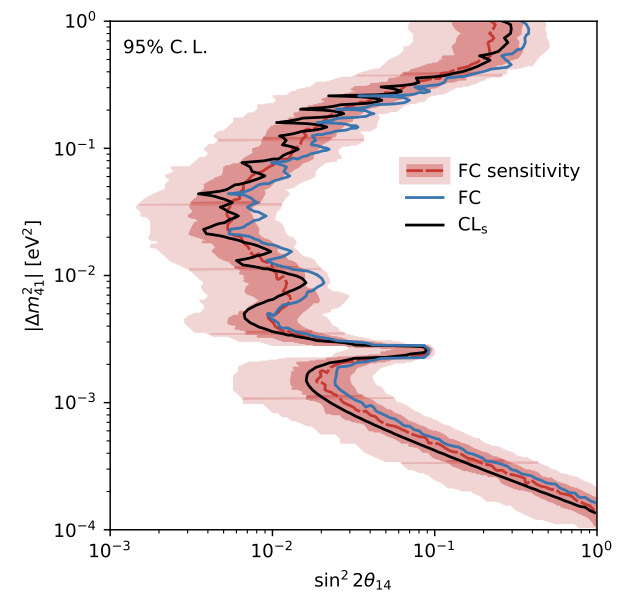
Опубликовано в: Phys.Rev.Lett. 133 (2024) 5, 051801
- Что здесь исключено?
- Почему это исключение обосновано?
- Что такое “FC sensitivity”?
- Что такое CL\(_s\)?
В этих графиках скрыто много понятий
- случайные флуктуации
- распределения вероятности
- правдоподобие и \(\chi^2\)
- best fit
- доверительные интервалы и контуры
- значимость и \(p\)-value
- систематические неопределенности
- nuisance-параметры
- профилирование
- верхние пределы и исключения
Если пока не все из этого понятно, этот курс для вас
Чему мы научимся?
- Вероятность, теорема Байеса
- Случайные величины и плотности вероятности
- Математическое ожидание, распространение ошибок
- Различные распределения вероятности
- Метод Монте-Карло
- Статистические тесты: общие понятия
- Статистики тестов, многомерные методы
- Тесты goodness-of-fit: p-value, значимость, открытие и исключение
Чему мы научимся?
- Фельдман-Казинс, CL\(_s\) и другие методы
- Оценивание параметров, максимальное правдоподобие
- Метод наименьших квадратов
- Интервальные оценки, установление ограничений
- Nuisance-параметры, систематические неопределенности
- Примеры байесовского подхода
Начинаем
Игрушечный пример: определение ширины гауссианы
Предположим, что данные имеют гауссову форму \[ y(x)=\exp\!\left(-\frac{x^2}{2\sigma^2}\right), \] с известным центром \(x_0=0\) и нормировкой \(N=1\) и неизвестной шириной \(\sigma\).
Ваша задача: найти \(\sigma\), сравнив модель с данными.
Для каждого выбранного значения \(\sigma\) вычисляется \[ \chi^2(\sigma)=\sum_i \frac{[y_i-y(x_i;\sigma)]^2}{\delta y_i^2}. \]
Значение \(\sigma\), соответствующее best fit, минимизирует \(\chi^2\).
Псевдоданные и фит
Задачи
✍️ Одинаковый и разный ответ: вероятность орла на следующем броске
Монета имеет неизвестную вероятность выпадения орла \(p\).
После \(n\) бросков наблюдалось \(k\) орлов.
Рассмотрим две оценки вероятности орла на следующем броске:
частотная подстановка \[ P_{\mathrm{freq}}(\text{орёл})=\hat p=\frac{k}{n}, \]
байесовская predictive probability при равномерном prior \[ p\sim \mathrm{Beta}(1,1),\qquad P_{\mathrm{Bayes}}(\text{орёл}\mid k,n)=\frac{k+1}{n+2}. \]
Посчитайте обе вероятности для случая \[ n=2,\qquad k=1. \]
Посчитайте обе вероятности для случая \[ n=1,\qquad k=1. \]
В каком случае ответы совпали? В каком — различаются?
Подсказка. Для \(n=2,\;k=1\) обе вероятности равны \(1/2\). Для \(n=1,\;k=1\) ответы уже разные.