viewof chiDistNu = Inputs.range([1, 80], {value: 10, step: 1, label: "ν"})

chiDistGamma = (z) => {
  const p = [
    676.5203681218851,
    -1259.1392167224028,
    771.32342877765313,
    -176.61502916214059,
    12.507343278686905,
    -0.13857109526572012,
    9.9843695780195716e-6,
    1.5056327351493116e-7
  ];
  z -= 1;
  let x = 0.99999999999980993;
  for (let i = 0; i < p.length; i++) x += p[i] / (z + i + 1);
  const t = z + p.length - 0.5;
  return Math.sqrt(2 * Math.PI) * t ** (z + 0.5) * Math.exp(-t) * x;
}

chiDistPdf = (x, nu) => {
  if (x <= 0) return nu === 1 ? Infinity : 0;
  return x ** (nu / 2 - 1) * Math.exp(-x / 2) /
    (2 ** (nu / 2) * chiDistGamma(nu / 2));
}

chiDistXmax = Math.max(8, chiDistNu + 5 * Math.sqrt(2 * chiDistNu));
chiDistData = Array.from({length: 700}, (_, i) => {
  const x = 1e-4 + chiDistXmax * i / 699;
  return {x, y: chiDistPdf(x, chiDistNu)};
})
chiDistMean = chiDistNu;
chiDistSigma = Math.sqrt(2 * chiDistNu);
chiDistScaleY = Math.max(...chiDistData.filter(d => Number.isFinite(d.y)).map(d => d.y));

chiDistPlot = Plot.plot({
  width: 1050,
  height: 500,
  marginLeft: 70,
  marginBottom: 50,
  x: {label: "t", domain: [0, chiDistXmax], grid: true},
  y: {label: "f(t; ν)", domain: [0, 1.08 * chiDistScaleY], grid: true},
  marks: [
    Plot.areaY(chiDistData, {x: "x", y: "y", fill: "#4ea1ff", fillOpacity: 0.22}),
    Plot.line(chiDistData, {x: "x", y: "y", stroke: "#4ea1ff", strokeWidth: 4}),
    Plot.ruleX([chiDistMean], {stroke: "#ffb347", strokeWidth: 4}),
    Plot.ruleX(
      [chiDistMean - chiDistSigma, chiDistMean + chiDistSigma].filter(x => x > 0),
      {stroke: "#f2f2f2", strokeDasharray: "6,5", strokeWidth: 2}
    )
  ]
})

html`
<div class="clt-panel">
  <div style="display:flex; justify-content:center;">${chiDistPlot}</div>
  <div class="clt-summary">
    <span>ν = ${chiDistNu}</span>
    <span>E[χ²] = ${chiDistMean.toFixed(1)}</span>
    <span>стандартное отклонение χ² = √(2ν) = ${chiDistSigma.toFixed(2)}</span>
    <span>стандартное отклонение χ²/ν = √(2/ν) = ${Math.sqrt(2 / chiDistNu).toFixed(3)}</span>
  </div>
</div>`Качество согласия и статистическая значимость
Статистический анализ данных
Дмитрий В. Наумов (ОИЯИ)
После подгонки
Что мы уже умеем
К этой лекции мы умеем формулировать вероятностную модель данных и правило подгонки.
Для гауссовых ошибок мы минимизируем \[ \chi^2(\boldsymbol\theta) = \sum_{i=1}^{N} \frac{ \left[y_i-f(x_i;\boldsymbol\theta)\right]^2 }{\sigma_i^2}. \]
Минимум даёт оценку параметров: \[ \widehat{\boldsymbol\theta} = \operatorname{arg} \underset{\boldsymbol\theta}{\operatorname{min}}\, \chi^2(\boldsymbol\theta). \]
В окрестности минимума форма \(\chi^2\) даёт ковариационную матрицу параметров.
Что дальше?
Минимум существует почти всегда.
Даже плохая модель обычно имеет наилучшие параметры: \[ \chi^2_{\min} = \chi^2(\widehat{\boldsymbol\theta}). \]
Следующий важный вопрос:
- насколько хорошо модель описывает наблюдения?
- Это вопрос о качестве согласия модели с данными.
Пример: калибровочная прямая
Пусть измеряется отклик детектора в нескольких точках энергии: \[ y_i=a+b x_i+\varepsilon_i, \qquad \varepsilon_i\sim \mathrm N(0,\sigma_i^2). \]
Подгонка прямой всегда найдёт числа \(\widehat a\) и \(\widehat b\).
Но это ещё не означает, что данные действительно похожи на прямую.
Остатки после подгонки: \[ r_i = y_i-\widehat a-\widehat b x_i. \]
Именно остатки отвечают на вопрос о согласии.
Нормированные остатки
Если модель верна и ошибки оценены правильно, то величины \[ z_i = \frac{ y_i-f(x_i;\widehat{\boldsymbol\theta}) }{\sigma_i} \] должны быть типичными гауссовыми отклонениями.
Сумма квадратов нормированных остатков равна \[ \chi^2_{\min} = \sum_i z_i^2. \]
Большой вклад одной точки означает большой остаток в единицах её ошибки.
Большой суммарный вклад означает, что модель плохо описывает данные в целом.
Статистика
Теперь нас интересует не только \[ \widehat{\boldsymbol\theta}, \] но и \[ \chi^2_{\min}. \]
\(\chi^2_{\min}\) - это функция случайных переменных, значит сама - случайная переменная.
\(\chi^2_{\min}\) - это пример статистики
Статистика - измеримая числовая функция от выборки, не зависящая от неизвестных параметров распределения элементов выборки.
Вопрос лекции:
- Если модель верна, какие значения \(\chi^2_{\min}\) являются обычными, а какие уже редкими?
Для ответа нужно знать распределение \(\chi^2_{\min}\).
Фольклор физиков
Из физического фольклора
Часто физики говорят: \[ \frac{\chi^2_{\min}}{\nu}\approx 1 \quad\Longrightarrow\quad \text{согласие хорошее}, \] где \[ \nu=N-m \] это число степеней свободы, \(N\) - число точек, \(m\) - число подогнанных параметров.
Это неправильно. Совершенно неправильно.
Вероятность одного и того же отношения зависит от числа степеней свободы \(\nu\) (об этом дальше).
Вопрос дня
- Рассмотрим два случая:
- \(\chi^2_{\min}=12\) и \(\nu=10\) и
- \(\chi^2_{\min}=1200\) и \(\nu=1000\).
- В обоих случаях \[ \chi^2_{\min}/\nu = 1.2 \]
- В первом случае есть хорошее согласие модели с данными.
- Во втором случае согласие модели с данными маловероятно.
- Почему? Давайте разбираться!
Распределение \(\chi^2\)
Один нормированный остаток
Пусть \[ Z\sim \mathrm N(0,1). \]
Плотность \(Z\) равна \[ f_Z(z) = \frac{1}{\sqrt{2\pi}}e^{-z^2/2}. \]
Квадрат отклонения \[ T=Z^2\ge 0 \]
Большое значение \(T\) означает, что наблюдение оказалось далеко от ожидания в единицах своей ошибки.
Вывод: ветви и якобиан
Для \(t>0\) уравнение \[ z^2=t \] имеет два корня: \[ z=\sqrt t, \qquad z=-\sqrt t. \]
Для каждого корня якобиан равен \[ \left| \frac{dz}{dt} \right| = \frac{1}{2\sqrt t}. \]
Поэтому плотность вероятности \(T\) получается суммой вкладов двух ветвей:
Плотность вероятности \(f_T(t)\)
\[ \begin{aligned} f_T(t) &= f_Z(\sqrt t)\left|\frac{dz}{dt}\right|_{z=\sqrt t} + f_Z(-\sqrt t)\left|\frac{dz}{dt}\right|_{z=-\sqrt t}\\ &= \frac{f_Z(\sqrt t)+f_Z(-\sqrt t)}{2\sqrt t}. \end{aligned} \]
Так как \(f_Z(\sqrt t)=f_Z(-\sqrt t)\), \[ \boxed{ f_T(t) = \frac{1}{\sqrt{2\pi t}}e^{-t/2}, \qquad t>0. } \]
Это распределение \(\chi^2\) с одной степенью свободы.
Несколько независимых остатков
Пусть теперь есть \(\nu\) независимых стандартных гауссовых величин: \[ Z_1,\ldots,Z_\nu \sim \mathrm N(0,1). \]
Их совместная плотность пропорциональна \[ \exp\!\left[ -\frac12\sum_{i=1}^{\nu} z_i^2 \right]. \]
Обозначим \[ t = \sum_{i=1}^{\nu}z_i^2. \]
Это квадрат расстояния от центра в \(\nu\)-мерном пространстве нормированных отклонений.
Геометрия вывода
Совместная плотность зависит только от радиуса: \[ r^2=t. \]
Вероятность попасть в тонкий сферический слой радиуса \(r\) пропорциональна двум множителям: \[ \underbrace{e^{-r^2/2}}_{\text{плотность гаусса}} \times \underbrace{r^{\nu-1}\,dr}_{\text{объём слоя}}. \]
Переходим от \(r\) к \(t=r^2\): \[ r^{\nu-1}dr = \frac12 t^{\nu/2-1}dt. \]
Поэтому плотность по \(t\) имеет вид \[ f(t;\nu)\propto t^{\nu/2-1}e^{-t/2}. \]
Формула распределения
После нормировки получаем \[ \boxed{ f(t;\nu) = \frac{1}{2^{\nu/2}\Gamma(\nu/2)} t^{\nu/2-1}e^{-t/2}, \qquad t\ge 0. } \]
Это распределение \(\chi^2\) с \(\nu\) степенями свободы.
Здесь \[ \Gamma(a) = \int_0^\infty u^{a-1}e^{-u}\,du \] это гамма-функция.
Она обобщает факториал: \[ \Gamma(n)=(n-1)! \quad\text{для целого } n\ge 1, \qquad \Gamma(1/2)=\sqrt\pi. \]
Математическое ожидание
Используем плотность \(\chi^2_\nu\): \[ f(t;\nu) = \frac{1}{2^{\nu/2}\Gamma(\nu/2)} t^{\nu/2-1}e^{-t/2}. \]
Тогда \[ \begin{aligned} \mathbb E[T] &= \int_0^\infty t f(t;\nu)\,dt\\ &= \frac{1}{2^{\nu/2}\Gamma(\nu/2)} \int_0^\infty t^{\nu/2}e^{-t/2}\,dt. \end{aligned} \]
Подстановка \(t=2u\) даёт \[ \mathbb E[T] = 2\frac{\Gamma(\nu/2+1)}{\Gamma(\nu/2)} = \nu. \]
Дисперсия
Аналогично \[ \begin{aligned} \mathbb E[T^2] &= \frac{1}{2^{\nu/2}\Gamma(\nu/2)} \int_0^\infty t^{\nu/2+1}e^{-t/2}\,dt\\ &= 4\frac{\Gamma(\nu/2+2)}{\Gamma(\nu/2)} = \nu(\nu+2). \end{aligned} \]
Поэтому \[ \operatorname{Var}(T) = \mathbb E[T^2]-\mathbb E[T]^2 = \nu(\nu+2)-\nu^2 = 2\nu. \]
Итак, \[ \boxed{ \mathbb E[\chi^2_\nu]=\nu, \qquad \operatorname{Var}(\chi^2_\nu)=2\nu. } \]
Число степеней свободы задаёт не только среднее, но и ширину распределения.
Интерактив: распределение \(\chi^2\)
Если ошибки коррелированы
Если ошибки коррелированы, то сумма квадратов записывается через ковариационную матрицу: \[ \chi^2 = (\mathbf y-\boldsymbol\lambda)^{\mathsf T} V^{-1} (\mathbf y-\boldsymbol\lambda). \]
Вопрос:
- Если между измерениями есть корреляции, не становится ли независимых величин меньше?
Ответ: нет, если ковариационная матрица невырождена.
Корреляции меняют координаты и масштабы, но не размерность пространства.
Диагонализация билинейной формы
Ковариационную матрицу можно диагонализовать: \[ V = Q\Lambda Q^{\mathsf T}, \qquad \Lambda=\operatorname{diag}(\lambda_1,\ldots,\lambda_N). \]
Если все \(\lambda_i>0\), введём новые переменные \[ \mathbf z = \Lambda^{-1/2}Q^{\mathsf T} (\mathbf y-\boldsymbol\lambda). \]
Тогда \[ \chi^2 =\mathbf z^{\mathsf T}\mathbf z =\sum_{i=1}^{N}z_i^2. \]
Размерность осталась равной \(N\).
Точное уменьшение числа направлений возникает только при настоящем ограничении, когда одна из собственных дисперсий равна нулю и \(V\) становится вырожденной.
Почему после подгонки меньше степеней свободы
После перехода к независимым нормированным переменным данные живут в \(N\)-мерном пространстве.
Если параметры не подгоняются, то \(\chi^2\) — это квадрат длины вектора данных относительно заданной модели.
Если модель линейна по \(m\) подгоняемым параметрам, то эти параметры задают \(m\)-мерную поверхность возможных предсказаний.
Подгонка выбирает ближайшую точку этой поверхности.
Остаток — это часть вектора, ортогональная поверхности модели.
В линейной гауссовой задаче размерность пространства остатков равна \(N-m\).
Поэтому \[ \boxed{ \nu=N-m, } \] где \(m\) - число подгоняемых параметров.
Это не связано с корреляциями между измерениями. Это связано с тем, что сами данные использованы для выбора \(m\) параметров модели.
Пример: подгонка константы
Пусть измеряется одна и та же величина: \[ y_i=\mu+\varepsilon_i, \qquad \varepsilon_i\sim \mathrm N(0,\sigma^2). \]
Если \(\mu\) задана заранее, то \[ \chi^2(\mu) = \sum_{i=1}^{N} \frac{(y_i-\mu)^2}{\sigma^2} \sim \chi^2_N. \]
Если \(\mu\) оценивается по этим же данным, \[ \widehat\mu = \frac1N\sum_i y_i, \] то сумма остатков обязана быть равна нулю: \[ \sum_i (y_i-\widehat\mu) =0. \]
Это одно линейное условие на остатки.
Куда делась одна степень свободы
Обозначим вектор остатков \[ \mathbf r = (y_1-\widehat\mu,\ldots,y_N-\widehat\mu). \]
Условие \[ \sum_i r_i=0 \] означает, что \(\mathbf r\) лежит не во всём \(N\)-мерном пространстве, а в гиперплоскости размерности \(N-1\).
Геометрически подгонка константы вычитает из данных проекцию на направление \[ (1,1,\ldots,1). \]
Одно направление исчезло, поэтому \[ \chi^2_{\min}\sim \chi^2_{N-1}. \]
Всегда ли распределение \(\chi^2_{\mathrm{min}}\) это \(\chi^2_\nu\)?
Нет. Если
- модель существенно нелинейна;
- параметры находятся на физической границе;
- ошибки зависят от параметров;
- есть малые пуассоновские счёты;
- есть точные ограничения или вырожденная ковариационная матрица.
В таких случаях статистика может иметь распределение, отличающееся от \(\chi^2_\nu\).
В этих и похожих случаях следует получить распределение статистики \(\chi^2_{\mathrm{min}}\) при помощи псевдоэкспериментов.
\(p\)-уровень значимости
\(p\)-уровень значимости
Пусть после подгонки получено \[ \chi^2_{\mathrm{obs}}. \]
Если применимо распределение \(\chi^2_\nu\), то \(p\)-уровень равен \[ \boxed{ p = \int_{\chi^2_{\mathrm{obs}}}^{\infty} f(t;\nu)\,dt. } \]
Это вероятность получить такое же или большее несогласие с моделью при условии, что модель верна.
Чем меньше \(p\), тем менее типично наблюдённое значение \(\chi^2_{\mathrm{obs}}\).
\(p\)-уровень на графике
viewof pLevelNu = Inputs.range([1, 120], {value: 50, step: 1, label: "ν"})
viewof pLevelObs = Inputs.range([0, 180], {value: 70, step: 0.5, label: "χ²_obs"})

pLevelXmax = Math.max(12, pLevelObs + 8 * Math.sqrt(2 * pLevelNu), pLevelNu + 8 * Math.sqrt(2 * pLevelNu));
pLevelData = Array.from({length: 1400}, (_, i) => {
  const x = 1e-4 + pLevelXmax * i / 1399;
  return {x, y: chiDistPdf(x, pLevelNu)};
});
pLevelTailData = pLevelData.filter(d => d.x >= pLevelObs);
pLevelTailArea = pLevelTailData.slice(1).reduce((s, d, i) => {
  const p = pLevelTailData[i];
  return s + 0.5 * (d.y + p.y) * (d.x - p.x);
}, 0);
pLevelYmax = 1.08 * Math.max(...pLevelData.filter(d => Number.isFinite(d.y)).map(d => d.y));

pLevelPlot = Plot.plot({
  width: 1050,
  height: 430,
  marginLeft: 70,
  marginBottom: 50,
  x: {label: "χ²", domain: [0, pLevelXmax], grid: true},
  y: {label: "f(χ²; ν)", domain: [0, pLevelYmax], grid: true},
  marks: [
    Plot.line(pLevelData, {x: "x", y: "y", stroke: "#6ea8ff", strokeWidth: 5}),
    Plot.areaY(pLevelTailData, {x: "x", y: "y", fill: "#ff4d4d", fillOpacity: 0.62}),
    Plot.ruleX([pLevelObs], {stroke: "#ff4d4d", strokeWidth: 3}),
    Plot.text([{x: Math.min(pLevelObs + 0.12 * pLevelXmax, 0.88 * pLevelXmax), y: 0.35 * pLevelYmax, label: "p"}],
      {x: "x", y: "y", text: "label", fill: "#ffffff", fontSize: 26, fontWeight: 700})
  ]
});

html`
<div class="clt-panel">
  <div style="display:flex; justify-content:center;">${pLevelPlot}</div>
  <div class="clt-summary">
    <span>ν = ${pLevelNu}</span>
    <span>χ²_obs = ${pLevelObs.toFixed(1)}</span>
    <span>p ≈ ${pLevelTailArea < 1e-3 ? pLevelTailArea.toExponential(2) : pLevelTailArea.toFixed(3)}</span>
  </div>
</div>`
Алгоритм:
Генерируем “теорию” \(T\) и псевдонаблюдения \(t_{obs}\).
Вычисляем \(p\).
Если псевдоданные и теория описываются одной моделью, значения \(p\) распределены равномерно.
import numpy as np

rng = np.random.default_rng(12345)

nu = 10
B_cal = 100_000
B_obs = 5_000

# Калибровка распределения статистики.
T_cal = rng.chisquare(df=nu, size=B_cal)
T_cal.sort()

# Независимые псевдонаблюдения.
T_obs = rng.chisquare(df=nu, size=B_obs)

# Для каждого наблюдённого t считаем p-уровень.
n_right = B_cal - np.searchsorted(T_cal, T_obs, side="left")
p = n_right / B_cal

hist, edges = np.histogram(p, bins=np.linspace(0, 1, 21), density=True)
pUniformRandomFactory = () => {
let state = 246813579;
return () => {
state = (1664525 * state + 1013904223) >>> 0;
return state / 4294967296;
};
}
pUniformNormal = (rand) => {
const u1 = Math.max(rand(), 1e-12);
const u2 = rand();
return Math.sqrt(-2 * Math.log(u1)) * Math.cos(2 * Math.PI * u2);
}
pUniformChi2Sample = (count, nu, rand) => {
const out = [];
for (let b = 0; b < count; b++) {
let t = 0;
for (let i = 0; i < nu; i++) {
const z = pUniformNormal(rand);
t += z * z;
}
out.push(t);
}
return out;
}
pUniformSamples = {
const rand = pUniformRandomFactory();
const nu = 10;
const calibration = pUniformChi2Sample(20000, nu, rand).sort((a, b) => a - b);
const observed = pUniformChi2Sample(5000, nu, rand);
return {nu, calibration, observed};
}
pUniformLowerBound = (arr, x) => {
let lo = 0;
let hi = arr.length;
while (lo < hi) {
const mid = Math.floor((lo + hi) / 2);
if (arr[mid] < x) {
lo = mid + 1;
} else {
hi = mid;
}
}
return lo;
}
pUniformValues = {
const calibration = pUniformSamples.calibration;
const nCal = calibration.length;
return pUniformSamples.observed.map(t => {
const left = pUniformLowerBound(calibration, t);
const nRight = nCal - left;
return nRight / nCal;
});
}
pUniformHistogram = {
const nBins = 20;
const bins = Array.from({length: nBins}, () => 0);
for (const p of pUniformValues) {
const i = Math.min(nBins - 1, Math.floor(p * nBins));
bins[i] += 1;
}
return bins.map((n, i) => ({
x1: i / nBins,
x2: (i + 1) / nBins,
y: n / pUniformValues.length * nBins
}));
}
pUniformPlot = Plot.plot({
width: 1050,
height: 430,
marginLeft: 70,
marginBottom: 55,
x: {label: "p", domain: [0, 1], grid: true},
y: {label: "плотность", domain: [0, 1.45], grid: true},
marks: [
Plot.rectY(pUniformHistogram, {
x1: "x1",
x2: "x2",
y: "y",
fill: "#6ea8ff",
fillOpacity: 0.70
}),
Plot.ruleY([1], {stroke: "#ffb347", strokeWidth: 4, strokeDasharray: "8,7"})
]
})
html`
<div class="clt-panel">
<div style="display:flex; justify-content:center;">${pUniformPlot}</div>
<div class="clt-summary">
<span>${pUniformSamples.calibration.length} значений для калибровки</span>
<span>${pUniformSamples.observed.length} псевдонаблюдений</span>
<span>ожидаемая плотность равна 1</span>
</div>
</div>`Односторонний перевод \(p\to Z\)
Удобно переводить \(p\) в число сигма.
Односторонний перевод: \[ p = P(Z_{\mathrm G}\ge Z) = 1-\Phi(Z). \]
Значит, \[ \boxed{ Z=\Phi^{-1}(1-p). } \]
Здесь \(\Phi\) — функция распределения стандартной нормальной величины.
oneSideGaussZ = 2
oneSideGaussPdf = z => Math.exp(-0.5 * z * z) / Math.sqrt(2 * Math.PI)
oneSideGaussData = Array.from({length: 900}, (_, i) => {
  const z = -4.5 + 9 * i / 899;
  return {z, y: oneSideGaussPdf(z), tail: z >= oneSideGaussZ};
})
oneSideGaussTail = oneSideGaussData.filter(d => d.tail)

oneSideGaussPlot = Plot.plot({
  width: 1050,
  height: 420,
  marginLeft: 70,
  marginBottom: 55,
  x: {label: "Z", domain: [-4.5, 4.5], grid: true},
  y: {label: "f_Z(z)", domain: [0, 0.43], grid: true},
  marks: [
    Plot.areaY(oneSideGaussTail, {x: "z", y: "y", fill: "#ff4f5e", fillOpacity: 0.65}),
    Plot.line(oneSideGaussData, {x: "z", y: "y", stroke: "#6ea8ff", strokeWidth: 4}),
    Plot.ruleX([oneSideGaussZ], {stroke: "#ffb347", strokeWidth: 4}),
    Plot.text([{z: oneSideGaussZ, y: 0.37, text: "Z"}], {
      x: "z",
      y: "y",
      text: "text",
      fill: "#ffffff",
      fontSize: 24,
      dy: -4
    }),
    Plot.text([{z: 2.95, y: 0.055, text: "p"}], {
      x: "z",
      y: "y",
      text: "text",
      fill: "#ffffff",
      fontSize: 28
    })
  ]
})

html`
<div class="clt-panel">
  <div style="display:flex; justify-content:center;">${oneSideGaussPlot}</div>
  <div class="clt-summary">
    <span>односторонний перевод: p = P(Z_G ≥ Z)</span>
    <span>площадь правого хвоста равна p-уровню</span>
  </div>
</div>`- Ориентиры для одностороннего перевода:
| \(Z\) | \(p=1-\Phi(Z)\) | \(q:\ P(\chi^2_1\ge q)=p\) |
|---|---|---|
| \(1\sigma\) | \(1.59\cdot 10^{-1}\) | \(1.99\) |
| \(2\sigma\) | \(2.28\cdot 10^{-2}\) | \(5.19\) |
| \(3\sigma\) | \(1.35\cdot 10^{-3}\) | \(10.27\) |
| \(4\sigma\) | \(3.17\cdot 10^{-5}\) | \(17.31\) |
| \(5\sigma\) | \(2.87\cdot 10^{-7}\) | \(26.34\) |
- Порог открытия в физике частиц обычно связывают с односторонним \(5\sigma\).
Двусторонний перевод
Для интервала у одного параметра нас обычно интересуют отклонения в обе стороны: \[ p = P(|Z_{\mathrm G}|\ge Z) = 2[1-\Phi(Z)]. \]
Если \[ \Delta\chi^2 = \chi^2(\theta)-\chi^2(\widehat\theta) \simeq \frac{(\theta-\widehat\theta)^2}{\sigma_\theta^2}, \] то \[ \Delta\chi^2 = Z^2. \]
Поэтому для одного параметра: \[ 1\sigma,\ 2\sigma,\ 3\sigma \quad\Longleftrightarrow\quad \Delta\chi^2=1,\ 4,\ 9. \]
twoSideGaussZ = 2
twoSideGaussPdf = z => Math.exp(-0.5 * z * z) / Math.sqrt(2 * Math.PI)
twoSideGaussData = Array.from({length: 900}, (_, i) => {
  const z = -4.5 + 9 * i / 899;
  return {
    z,
    y: twoSideGaussPdf(z),
    leftTail: z <= -twoSideGaussZ,
    rightTail: z >= twoSideGaussZ
  };
})
twoSideGaussLeftTail = twoSideGaussData.filter(d => d.leftTail)
twoSideGaussRightTail = twoSideGaussData.filter(d => d.rightTail)

twoSideGaussPlot = Plot.plot({
  width: 1050,
  height: 420,
  marginLeft: 70,
  marginBottom: 55,
  x: {label: "Z", domain: [-4.5, 4.5], grid: true},
  y: {label: "f_Z(z)", domain: [0, 0.43], grid: true},
  marks: [
    Plot.areaY(twoSideGaussLeftTail, {x: "z", y: "y", fill: "#ff4f5e", fillOpacity: 0.65}),
    Plot.areaY(twoSideGaussRightTail, {x: "z", y: "y", fill: "#ff4f5e", fillOpacity: 0.65}),
    Plot.line(twoSideGaussData, {x: "z", y: "y", stroke: "#6ea8ff", strokeWidth: 4}),
    Plot.ruleX([-twoSideGaussZ, twoSideGaussZ], {stroke: "#ffb347", strokeWidth: 4}),
    Plot.text([
      {z: -2.85, y: 0.055, text: "p/2"},
      {z: 2.85, y: 0.055, text: "p/2"}
    ], {
      x: "z",
      y: "y",
      text: "text",
      fill: "#ffffff",
      fontSize: 26
    })
  ]
})

html`
<div class="clt-panel">
  <div style="display:flex; justify-content:center;">${twoSideGaussPlot}</div>
  <div class="clt-summary">
    <span>двусторонний перевод: p = P(|Z_G| ≥ Z)</span>
    <span>для одного параметра затем получается Δχ² = Z²</span>
  </div>
</div>`- Ориентиры для двустороннего перевода:
| интервал | двусторонний \(p\) | \(\Delta\chi^2\) |
|---|---|---|
| \(1\sigma\) | \(3.17\cdot 10^{-1}\) | \(1\) |
| \(2\sigma\) | \(4.55\cdot 10^{-2}\) | \(4\) |
| \(3\sigma\) | \(2.70\cdot 10^{-3}\) | \(9\) |
| \(4\sigma\) | \(6.33\cdot 10^{-5}\) | \(16\) |
| \(5\sigma\) | \(5.73\cdot 10^{-7}\) | \(25\) |
- Не надо смешивать эти два соглашения: открытие обычно одностороннее, интервал для одного параметра обычно двусторонний.
Ответ дня. Почему нельзя писать \(\chi^2/\mathrm{ndf} = 1.2\)?
- Вот почему
| \(\chi^2_{\mathrm{obs}}\) | \(\nu\) | \(\chi^2_{\mathrm{obs}}/\nu\) | \(z_{\chi^2}\) | \(p\) |
|---|---|---|---|---|
| \(12\) | \(10\) | \(1.20\) | \(0.45\) | \(0.285\) |
| \(1200\) | \(1000\) | \(1.20\) | \(4.47\) | \(1.2\cdot 10^{-5}\) |
где \[ z_{\chi^2} = \frac{\chi^2_{\mathrm{obs}}-\nu}{\sqrt{2\nu}}. \] отклонение от среднего в единицах “ошибки”
В обоих случаях отношение одинаковое.
Во втором случае значение \(\chi^2\) гораздо менее вероятно.
Правильно сообщать так:
\(\chi^2_{min}/ndf = 1200/1000\).
Как интерпретировать \(p\)?
- Неправильно:
Модель неверна с вероятностью \(1-p\).
- Правильно:
Вероятность получить такие или более несогласованные данные, при условии справедливости модели, равна p.
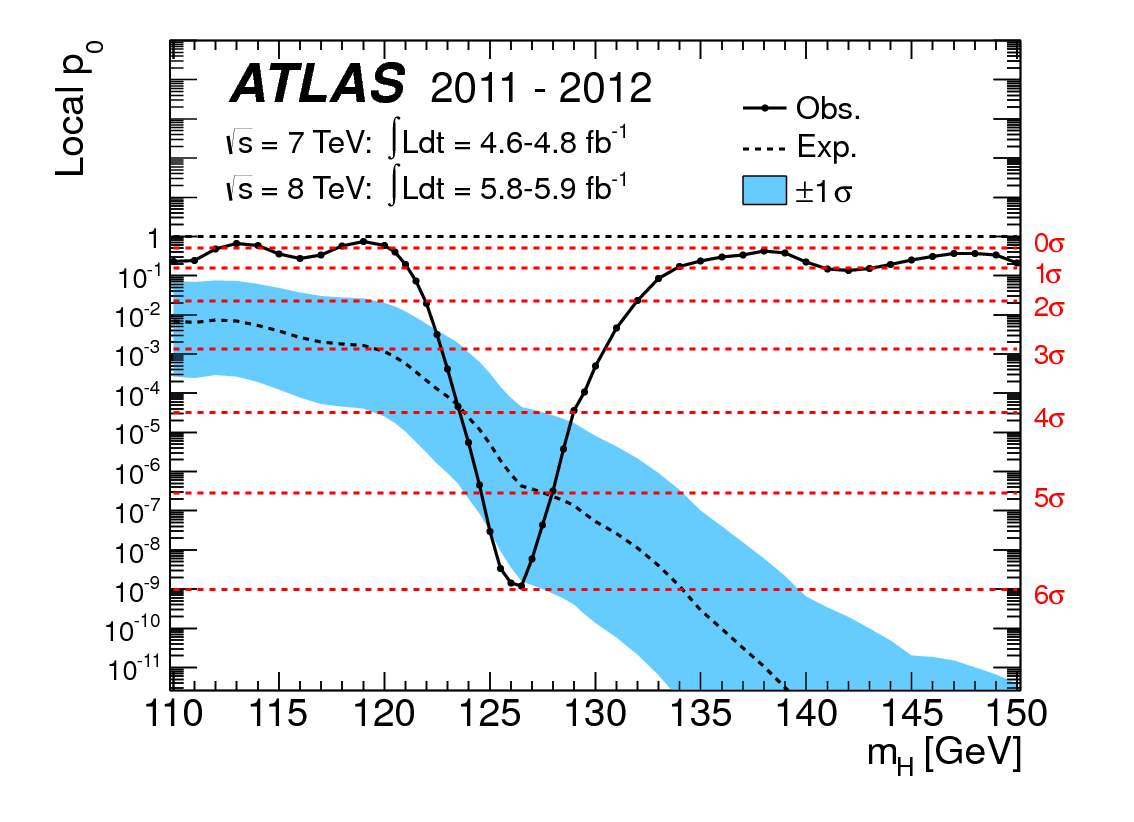
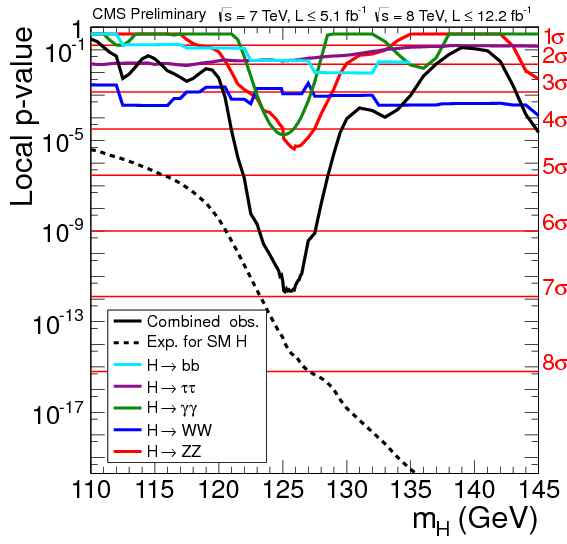
Пример: бозон Хиггса
По горизонтали перебирается масса гипотетического бозона.
В каждой точке считают локальный \(p\)-уровень фоновой гипотезы.
Это проверка гипотезы, а не \(p\)-уровень качества подгонки. Об этом в другой лекции.
Горизонтальные линии \(1\sigma,\ldots,5\sigma\) — это перевод \(p\leftrightarrow Z\).
Глубокий минимум около \(125\,\mathrm{GeV}\) означает: фон сам по себе редко даёт такие данные.
Как получить распределение статистики
Когда формулы недостаточно
Если известно, что \[ \chi^2_{\min}\sim\chi^2_{N-m}, \] то \(p\) находится аналитически.
Если это не гарантировано, не нужно угадывать новое число степеней свободы.
Нужно построить распределение той же статистики в той же процедуре анализа.
Идея:
Сколько раз верная модель сама рождает значение статистики не меньше наблюдённого?
Пример: малые пуассоновские бины
Пусть модель предсказывает ожидания \(\nu_i\) в \(N=20\) бинах.
Данные в каждом бине пуассоновские: \[ n_i \sim \operatorname{Pois}(\nu_i). \]
Статистика Пирсона: \[ \chi^2_{\mathrm P} = \sum_{i=1}^{N} \frac{(n_i-\nu_i)^2}{\nu_i}. \]
При больших \(\nu_i\) ожидаем приближение \[ \chi^2_{\mathrm P}\sim \chi^2_N. \]
Но если в части бинов ожидания малы, хвост распределения может отличаться.
Нужно моделировать ровно ту статистику, которую применяем к данным:
import numpy as np

nu = np.array([
    0.158, 0.295, 0.513, 0.833, 1.263,
    1.785, 2.355, 2.899, 3.330, 3.568,
    3.568, 3.330, 2.899, 2.355, 1.785,
    1.263, 0.833, 0.513, 0.295, 0.158,
])

rng = np.random.default_rng(12345)
B = 1_000_000

n = rng.poisson(nu, size=(B, len(nu)))
T = ((n - nu)**2 / nu).sum(axis=1)

T_obs = 29.8
p_model = np.mean(T >= T_obs)

print(p_model)

# Для T_obs = 29.8:
# p_model ≈ 0.11.
# Для сравнения: χ²_20-приближение даёт p ≈ 0.073.
\(\nu_i\) — не случайные числа, а ожидания модели в бинах.
Случайны только наблюдённые счёты: \[ n_i\sim\operatorname{Pois}(\nu_i). \]
В этом примере специально есть бины с малыми ожиданиями.
| бин | \(\nu_i\) | бин | \(\nu_i\) | бин | \(\nu_i\) | бин | \(\nu_i\) | бин | \(\nu_i\) |
|---|---|---|---|---|---|---|---|---|---|
| 1 | 0.158 | 5 | 1.263 | 9 | 3.330 | 13 | 2.899 | 17 | 0.833 |
| 2 | 0.295 | 6 | 1.785 | 10 | 3.568 | 14 | 2.355 | 18 | 0.513 |
| 3 | 0.513 | 7 | 2.355 | 11 | 3.568 | 15 | 1.785 | 19 | 0.295 |
| 4 | 0.833 | 8 | 2.899 | 12 | 3.330 | 16 | 1.263 | 20 | 0.158 |
Интерактив: распределение статистики
viewof cowanObs = Inputs.range([0, 60], {value: 29.8, step: 0.1, label: "χ²_obs"})

cowanNuModel = [
  0.158, 0.295, 0.513, 0.833, 1.263,
  1.785, 2.355, 2.899, 3.330, 3.568,
  3.568, 3.330, 2.899, 2.355, 1.785,
  1.263, 0.833, 0.513, 0.295, 0.158
]

cowanRandomFactory = () => {
  let state = 123456789;
  return () => {
    state = (1664525 * state + 1013904223) >>> 0;
    return state / 4294967296;
  };
}

cowanPoisson = (lambda, rand) => {
  const l = Math.exp(-lambda);
  let k = 0;
  let p = 1;
  do {
    k += 1;
    p *= rand();
  } while (p > l);
  return k - 1;
}

cowanToyStats = {
  const rand = cowanRandomFactory();
  const out = [];
  const bCount = 80000;
  for (let b = 0; b < bCount; b++) {
    let t = 0;
    for (const mu of cowanNuModel) {
      const n = cowanPoisson(mu, rand);
      const d = n - mu;
      t += d * d / mu;
    }
    out.push(t);
  }
  return out;
}

cowanHistogram = {
  const binWidth = 1;
  const bins = Array.from({length: 60}, () => 0);
  for (const t of cowanToyStats) {
    if (t >= 0 && t < 60) bins[Math.floor(t / binWidth)] += 1;
  }
  return bins.map((n, i) => ({
    x1: i * binWidth,
    x2: (i + 1) * binWidth,
    y: n / (cowanToyStats.length * binWidth)
  }));
}

cowanChi2Data = Array.from({length: 1200}, (_, i) => {
  const x = 1e-4 + 60 * i / 1199;
  return {x, y: chiDistPdf(x, 20)};
})

cowanChi2Tail = {
  const xmax = 90;
  const nStep = 1800;
  let s = 0;
  let x0 = cowanObs;
  let y0 = chiDistPdf(x0, 20);
  for (let i = 1; i <= nStep; i++) {
    const x1 = cowanObs + (xmax - cowanObs) * i / nStep;
    const y1 = chiDistPdf(x1, 20);
    s += 0.5 * (y0 + y1) * (x1 - x0);
    x0 = x1;
    y0 = y1;
  }
  return s;
}

cowanModelP = cowanToyStats.filter(t => t >= cowanObs).length / cowanToyStats.length;
cowanFmtP = (p) => p < 1e-3 ? p.toExponential(2) : p.toFixed(3);

cowanPlot = Plot.plot({
  width: 1050,
  height: 455,
  marginLeft: 70,
  marginBottom: 50,
  x: {label: "T", domain: [0, 60], grid: true},
  y: {label: "плотность", domain: [0, 0.10], grid: true},
  color: {legend: true},
  marks: [
    Plot.rectY(cowanHistogram, {
      x1: "x1",
      x2: "x2",
      y: "y",
      fill: "#b8b8b8",
      fillOpacity: 0.62
    }),
    Plot.line(cowanChi2Data, {
      x: "x",
      y: "y",
      stroke: "#6ea8ff",
      strokeWidth: 4
    }),
    Plot.ruleX([cowanObs], {stroke: "#ff4d4d", strokeWidth: 4}),
    Plot.text([{x: Math.min(cowanObs + 5, 52), y: 0.075, label: "χ²_obs"}],
      {x: "x", y: "y", text: "label", fill: "#ffffff", fontSize: 22})
  ]
})

html`
<div class="clt-panel">
  <div style="display:flex; justify-content:center;">${cowanPlot}</div>
  <div class="clt-summary">
    <span>20 пуассоновских бинов</span>
    <span>χ²_obs = ${cowanObs.toFixed(1)}</span>
    <span>p из моделирования ≈ ${cowanFmtP(cowanModelP)}</span>
    <span>p по χ²₂₀ ≈ ${cowanFmtP(cowanChi2Tail)}</span>
  </div>
</div>`
Что нужно запомнить?
В линейной гауссовой задаче с фиксированной ковариацией: \[ \chi^2_{\min}\sim\chi^2_{N-m}. \]
Подгоняемые параметры уменьшают размерность пространства остатков.
Если условия для формулы сомнительны, распределение статистики получают псевдоэкспериментами.
В результате всегда нужно сообщать: \[ \chi^2_{\min}, \qquad \nu\ \text{или способ калибровки}, \qquad p. \]